Mark Belan/Quanta Magazine
Introduction
In the 1960s, the Soviet climatologist and mathematician Mikhail Budyko set out to investigate the potential future of a planet on the brink of nuclear Armageddon. He started by looking some 600 million years into the past.
Back then, some scientists claimed, the ancient planet was an iced-over snowball. Most researchers considered that a crackpot theory. Ice over the equator? Please. But Budkyo developed a mathematical model to back it up. If sea ice had been able to expand past a critical latitude, he suggested, then its reflective surface would have returned more sunlight to space. This would have kicked off an out-of-control feedback loop: The planet would cool further and ice would build up until it spread everywhere. The Earth would, in other words, tip from one equilibrium into a different one, reaching a new stable — and frozen — state.
Budyko’s investigation was motivated by a pressing question: If the global climate had tipped dramatically and catastrophically in the past, could humans tip it in the present? He and others feared what would happen if the United States and the Soviet Union launched their nuclear arsenals. “They realized, look, if we block the sun for sufficiently long, we’re going to just destroy life on the planet,” said Valerio Lucarini, a statistical physicist studying the Earth’s climate at the University of Leicester. “Not even the cockroaches will survive.”
The missiles didn’t launch. But it turned out that nukes weren’t necessary for humans to tip the climate. By the time Budyko was building his Snowball Earth models, it was clear that atmospheric carbon dioxide was rising, and with it global temperatures.
Since then, mathematicians have uncovered the potential for abrupt and radical shifts in Earth’s climate — known popularly as tipping points. The loss of sea ice could cause the oceans to absorb more of the sun’s heat, crossing a threshold that kicks off runaway ice melt and rising seas. The Amazon rainforest could wither into a savanna; coral reefs could bleach ghost-white; a major current in the Atlantic Ocean might go slack and fail to deliver warmth to Europe, turning Scotland into Siberia.
Tipping points often capture the worst-case scenarios of climate models: the reorganization of the world we know, and the human civilization we’ve built within it, into a new equilibrium state — an unimaginable, frightening unknown.
Yet the math of tipping points is fraught with uncertainty. The Earth is certainly warming, and the effects of that warming, if left unchecked, will be dire. But tipping points are subtler phenomena. Slight changes in the assumptions a mathematical model is built on can cause tipping points to unfold very differently or even slip away entirely. And in most cases, scientists are armed with relatively little data, making it challenging to understand the chaotic nature of tippable climate systems, much less predict where they’re headed.
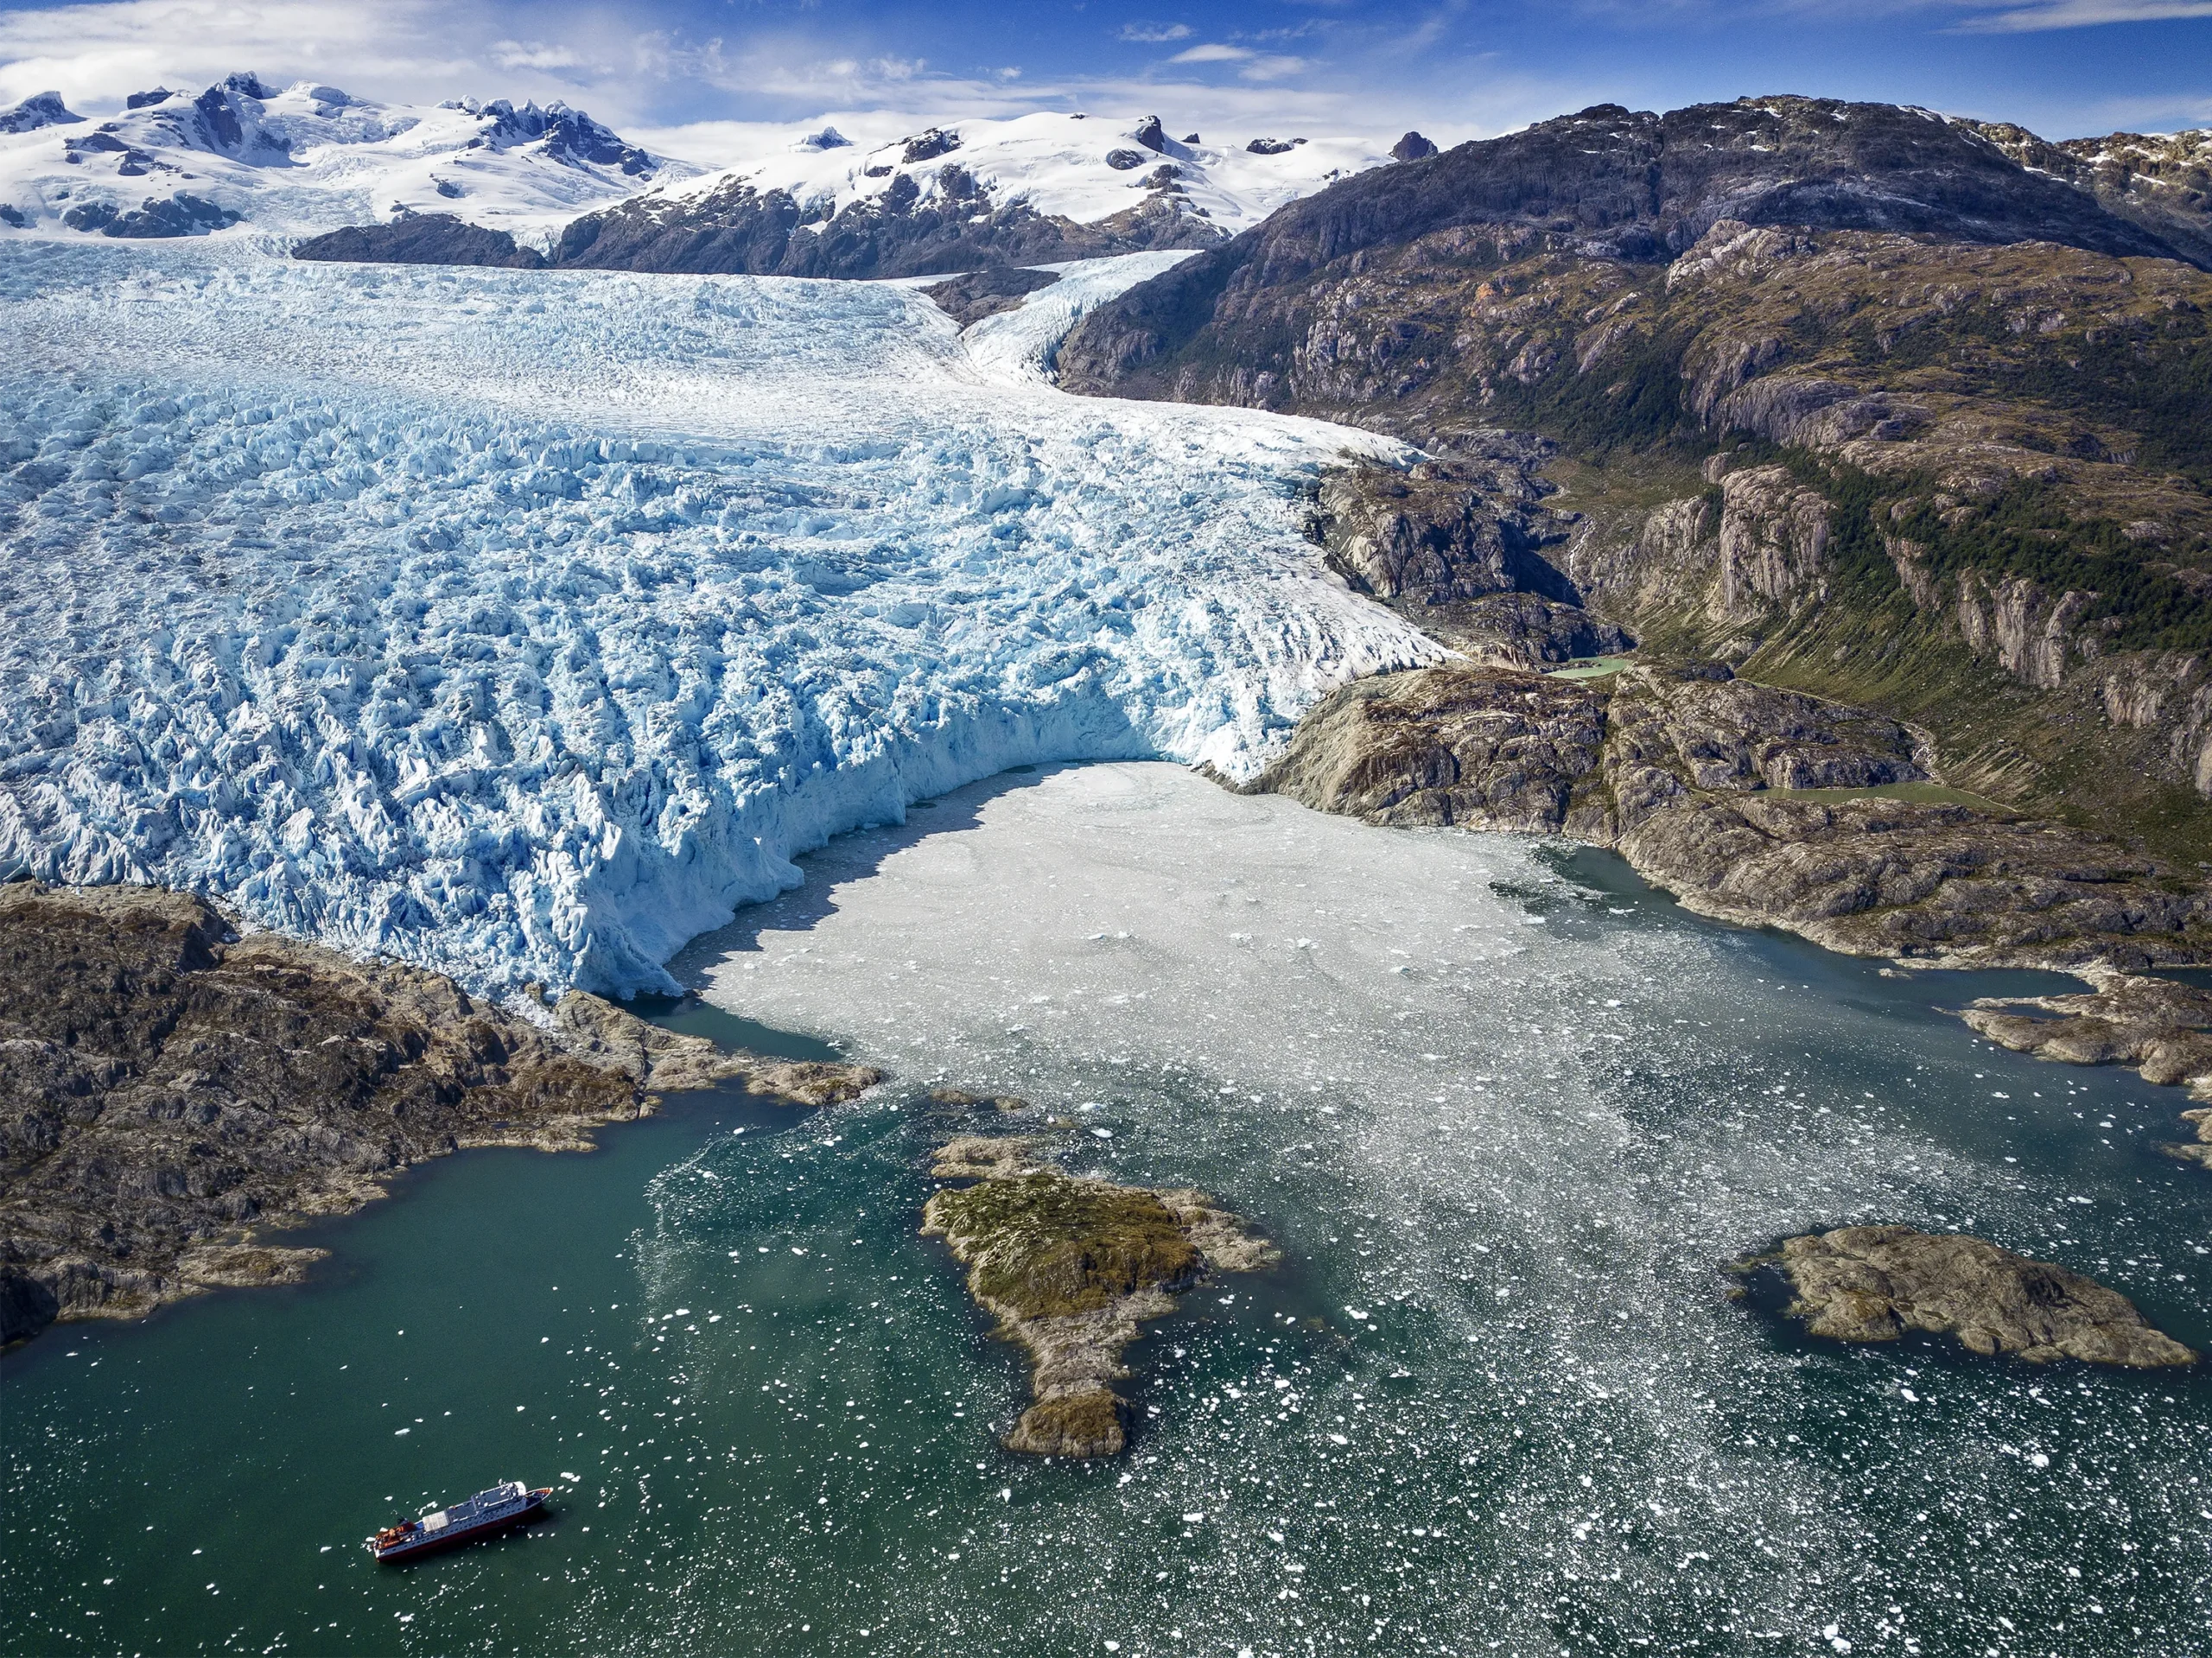
Glaciers might be melting toward a catastrophic tipping point, leading to runaway ice melt and rising seas. Above, giant chunks of ice break off El Brujo Glacier in Chile.
Sergi Reboredo/VWPics/Science Source
The uncertainty is so great that some scientists question whether it’s useful to talk about tipping points at all. Perhaps these vague apocalyptic visions only cause confusion and distraction. If the scenarios are both terrifying and abstract, they might make people decide it’s just not worth the effort to fight climate change.
Mathematicians following in Budyko’s footsteps want to change the way we think about tipping points, and to translate them into meaningful information. “Natural systems don’t obey theorems — fortunately, or else the world would be a very boring place to live,” Lucarini said. But, he added, it’s urgent to find more nuanced ways to bridge the “big gray zone” between math and reality.
Mathematicians can’t change certain factors, like how little data they have to go on or how vulnerable model outcomes might be to their assumptions. But they’ve been studying tipping point behavior — in one form or another, and in all kinds of complex systems — for more than a century. In doing so, they’ve learned valuable lessons about what tipping points can and can’t reveal about Earth’s climate, and about how close to reality they should try to get. “You can live happily in the mirror world of math. It’s beautiful,” said Marten Scheffer, a complex systems theorist at Wageningen University. “But applying it to reality is a minefield.”
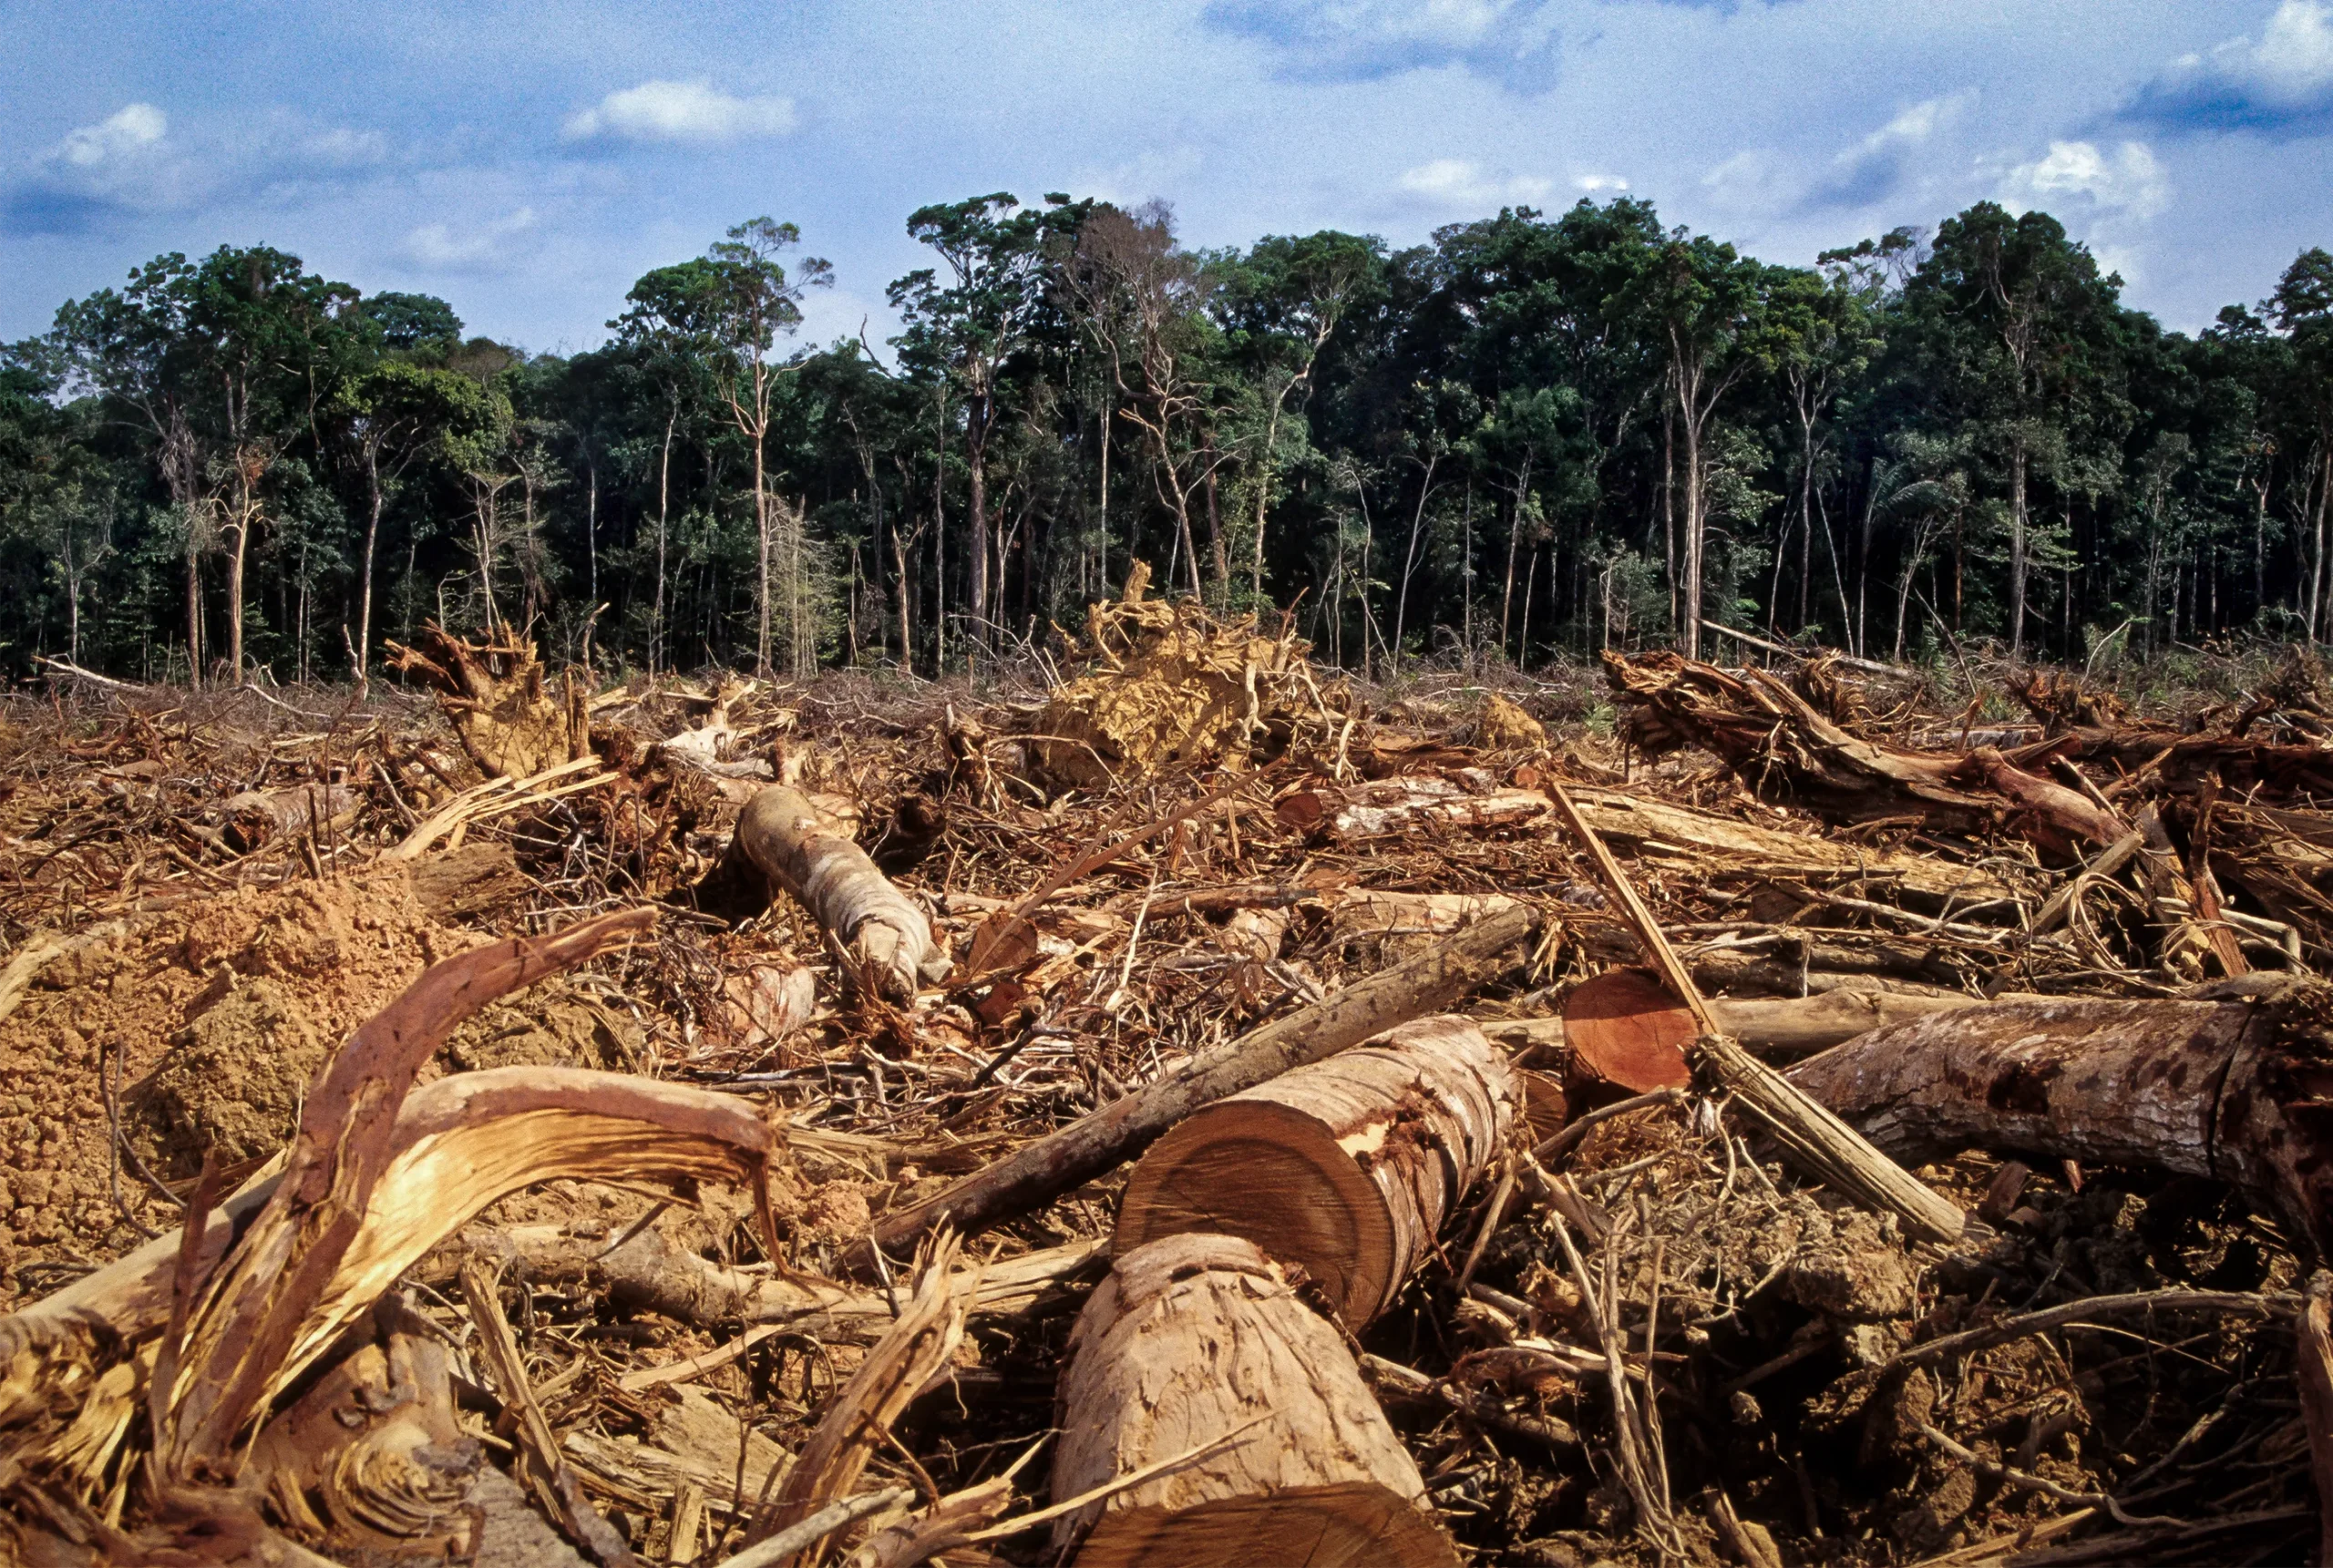
Deforestation and climate change have pushed the Amazon rainforest toward a tipping point. If crossed, it will lose its ability to regenerate and turn into a savanna.
luoman/iStock
The Shape of Change
In 1978, the mathematician Christopher Zeeman was invited to give the Royal Institution’s annual Christmas Lecture, a major televised event in London previously hosted by Carl Sagan and David Attenborough. During his lecture, Zeeman invited a woman from the live audience to play with a toy he called the “catastrophe machine.” The machine consisted of a wheel mounted to the middle of a wall and a long elastic band. The band was pinned to the top of the wall, and its midpoint was attached to the rim of the wheel; the remainder hung freely. Zeeman asked the woman to take the bottom end of the band and slowly tug it horizontally. As she did, the wheel rotated slightly. She pulled more. The band stretched and stretched — and then suddenly, for no apparent reason, the wheel rotated with a jerk. The audience yelped.
Zeeman had introduced Britain to the idea of a “bifurcation,” a point when a gradual change, such as gently pulling on a band attached to a wheel, can lead to a major shift in a system that arrives with surprising force. “If this surprise is nasty, you’re liable to call it a catastrophe,” Zeeman told his Christmas Day audience. He proceeded to explain the mathematics underlying his machine’s behavior, showing how bifurcation points emerge in different kinds of settings — how graphs of them might look like, say, a saddle, or a pitchfork, or a cone.
The fundamental notion of a bifurcation dates to 1885, when the French mathematician Henri Poincaré, inspired by studies of Saturn’s rings, modeled how fluids rotate around a mass. As the fluid rotates and cools down, it settles into a pear-like shape: an equilibrium state. If the cooling continues, he found, the pear eventually splits into two parts that cannot easily reunite. Since then, scientists have uncovered bifurcations throughout the physical world — in chemical reactions and in electronics, in our cells and in ecosystems.
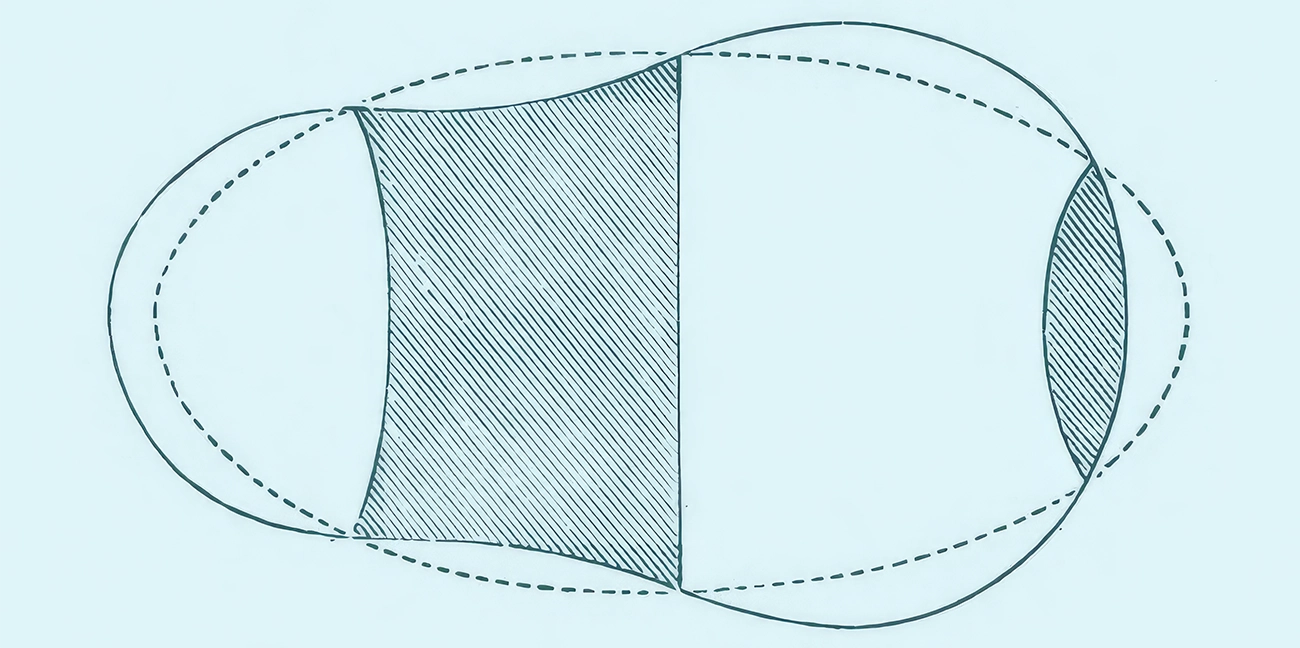
In an 1885 illustration, Henri Poincaré predicted that a rotating fluid would form a pear shape when it settled into one of its equilibrium states.
Courtesy of Scott Walter
In the 1960s and ’70s, some mathematicians, including Zeeman, pursued more ambitious aspirations: to model bifurcations for complex real-world scenarios, such as stock exchanges or social movements. They were proponents of a branch of bifurcation theory known as catastrophe theory, which by the time of Zeeman’s lecture was starting to captivate the world in a way that was unusual for any branch of mathematics. Its founder, the mathematician René Thom, had developed his ideas against the backdrop of the Vietnam War and the American civil rights movement. “This kind of study is literally describing counterculture,” Lucarini said. “The whole idea of bifurcations is something that can bring discomfort to the world.” In search of scientific ways to make sense of a world in constant flux, people called on catastrophe theory to describe everything from bridge collapses to prison riots to regime changes. As Zeeman put it, the dream was to give “mathematical grounding” to “descriptive science,” such as psychology.
But doing so meant making lots of assumptions about how complex systems worked. Catastrophe theory was “laughed away” by the scientific community, Scheffer said — dismissed as qualitative science dressed up in a lot of fancy math. The hype soon fizzled.
The concept of a bifurcation didn’t. The study of complex dynamical systems was taking off in math and physics; in the following decades, bifurcations would play a central role in several fields, such as chaos theory, which investigates how small bifurcations accumulate to produce the unpredictable behavior of phenomena like the weather.
But when it came to large-scale changes in the natural world, bifurcations existed primarily in the realm of theory. They were a convenient way to model a given scenario, but hard to observe directly.
At Peter Lake, a research site in Michigan, ecologists found a unique opportunity to do so.
Over decades of study, beginning in the 1950s, researchers had observed that the lake had at least two stable states. In one state, the water was murky and filled with algae. There were few predatory largemouth bass to eat minnows, which ran rampant and ate the water fleas that would otherwise have kept the algae in check. In the lake’s second equilibrium state, the bass thrived and ate the minnows, allowing more water fleas to survive and gobble up the algae. The water was clear.
Each state represents a kind of equilibrium called an attractor. It exerts a sort of gravitational pull on the system; small perturbations won’t push it out of equilibrium. So how could Peter Lake switch from one attractor to the second? Something must force the system into the new state, just like the woman gently tugging on Zeeman’s catastrophe machine.
At algae-filled Peter Lake, crafty researchers decided to do this intentionally by throwing extra bass into the water, which they started doing in 2008. For a while, the system was able to rebalance itself; the pull of its murky attractor state was strong. But as the bass population continued to increase, the system reached a bifurcation (or what ecologists call a “regime shift”). It teetered on the edge of the other attractor state, and then fell in. Soon the algae disappeared, and the lake became clear. Peter Lake became bass town.
For decades, ecologists have studied tipping points and other phenomena in northern Michigan’s Peter Lake. The lake provides a rare opportunity to perform controlled experiments in a large natural system.
Daniel Johnson/Fox Hill Photo
The scientists’ bifurcation models had panned out in nature. What’s more, in the behavior of the differential equations they’d used to describe the system, the ecologists found early warning signs of an approaching tip — a collection of statistical signals known as “critical slowing down.” Even though the lake might currently be full of algae, the attractor can give statistical signals that it’s losing its gravitational tug.
The strange thing was that the model worked despite its apparent simplicity. The scientists had intentionally left out many factors that could influence the system, such as other species that lived in the lake and weather patterns. But to understand bifurcations in Peter Lake, they found, it was enough to consider the algae, minnows, bass and fleas — that’s all. In fact, when ecologists try to add greater complexity to their models, they’re often no longer able to predict how the system will behave. That’s because “you’re selectively adding realism,” Scheffer said, while still missing other details; in trying to hew closer to reality, you actually end up being less accurate.
It was the same lesson the catastrophe theorists had learned decades earlier. “You have to keep modesty when you say that you understand how the world works,” Scheffer said.
When the Peter Lake results were published in 2011, they landed in a world poised on the edge of many regime shifts — overfishing, deforestation, insect outbreaks and more. But the one top of mind for many people was global climate change.
A Complex World
In a 2008 paper, the climate scientist Tim Lenton, who had spent years studying radical changes in climate models at the University of Exeter, gave them a new name: tipping points. He borrowed the term from a book of the same name, published a few years earlier by Malcolm Gladwell, who used “tipping points” to describe all sorts of phenomena, from epidemics to crime waves. (The term had previously been associated with what is known as white flight — or the likelihood that white residents would leave a neighborhood en masse once some threshold of Black or minority residents was reached.)
Lenton found it to be an evocative phrase. It was a call to action, he thought, that could compel people to care about a disastrously climate-changed future. A better word, certainly, than “bifurcation.”
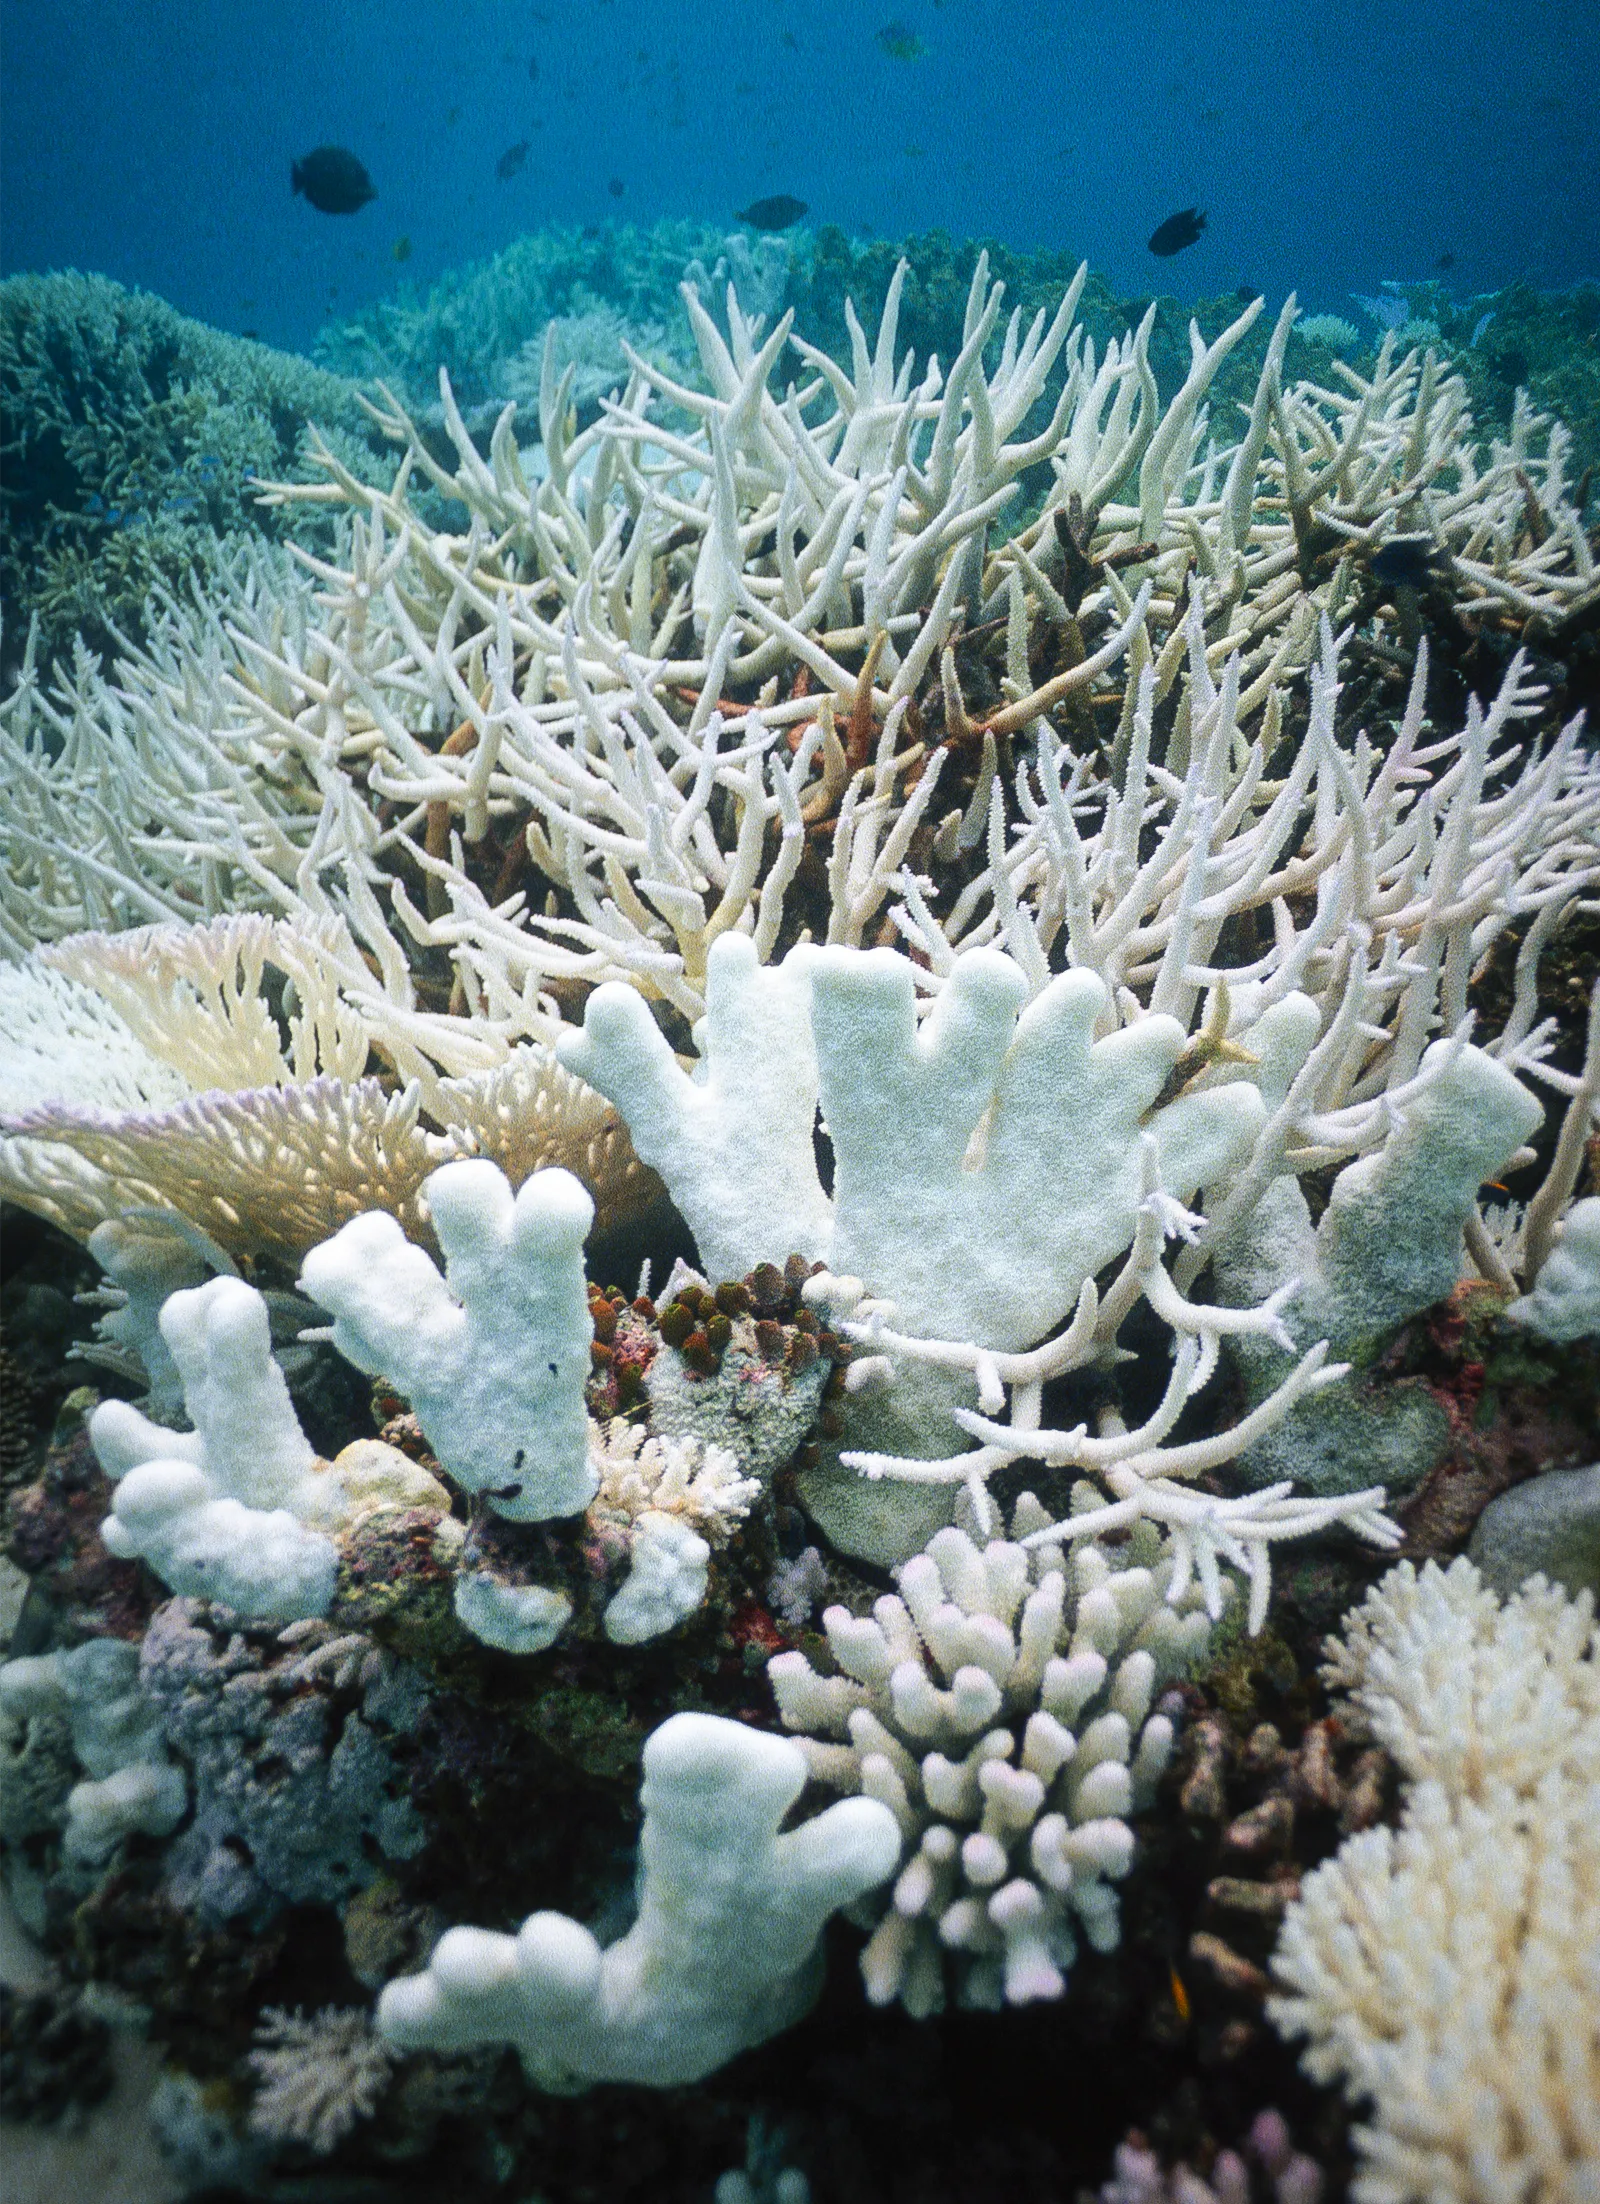
Ocean warming has distressed coral reefs, causing them to expel the symbiotic algae that give them their color. If such “coral bleaching” continues, the ecosystem could reach a tipping point, after which it will reorganize into a less diverse, more deteriorated state.
Georgette Douwma/Science Source
“Anything that is polysyllabic and Latinate doesn’t sound threatening enough,” said Michael Ghil, a mathematician at the University of California, Los Angeles, who studies theoretical climate dynamics. “‘Tipping points’ does.”
The idea that there had been major shifts in the Earth’s climate was by then well established. Scientists had found geological evidence that supported the Snowball Earth hypothesis. They’d seen hints that patterns in deep ocean currents had once looked very different. And six thousand years ago, they’d discovered, the Sahara Desert was a lush Eden. Only later did it reach a tipping point that transformed it into a sea of sand; today, hippopotamus bones lie buried beneath its dunes, a reminder of that bygone era. The history of Earth’s climate is full of such rapid, massive transitions.
But what’s the right math to describe those changes? Scientists who study tipping points readily admit that the term can be somewhat vague. Sometimes it’s used loosely to describe any large, sudden change that arises from small perturbations. Other times it’s used in a more specific and technical way, to signify an irreversible bifurcation that has a rigorous mathematical definition.
Moreover, the global climate is a much more complicated system than Peter Lake. The oceans and atmosphere are massive and, importantly, open, shaped by far-reaching forces that act on timescales ranging from hours to eons. The forcing of the system toward a bifurcation — caused by, say, a gradual buildup of carbon dioxide in the atmosphere — is defined by myriad subtle and interconnected variables. These “dimensions,” as mathematicians call them, can affect one another in complicated feedback loops. Where do you even start?
“With the climate, a load of people basically argue, ‘Oh, because it’s high-dimensional, you won’t get this simple, low-order bifurcation or tipping behavior,’” Lenton said. “They thought it couldn’t be that simple when you got into all the messy complexity.”
But physicists studying bifurcations had found that near or at the point of transition, the behavior of a complex system can simplify as it passes from one state to another. “Sometimes a high-dimensional system can tip,” said Lenton, “and when it gets near tipping, it starts to behave like a much lower-dimensional system.” The lesson, he added, echoes the one learned at Peter Lake: to “simplify without oversimplifying.”
Still, while bifurcations offer a helpful way to understand many past climatic changes, looking into the future presents new challenges. At Peter Lake, ecologists had the luxury of observation. Pay close enough attention to the water, and it’s possible to see attractors come and go, and to study their dynamics. Early warning signals become clear, in part, because the progression from a murky lake to a clear one is predictable under certain forcing conditions. But often, climate scientists can’t directly observe multiple states of the Earth. While they may have clues about where the climate is heading, they must also make many assumptions. This includes assumptions about the relationships between variables, about what a new equilibrium state might look like after a tipping point is reached, and about the nature of that tipping point — whether it’s caused by slowly adding more carbon dioxide to the atmosphere, by a sudden change in the pace of carbon dioxide production, or by random, short-term perturbations.
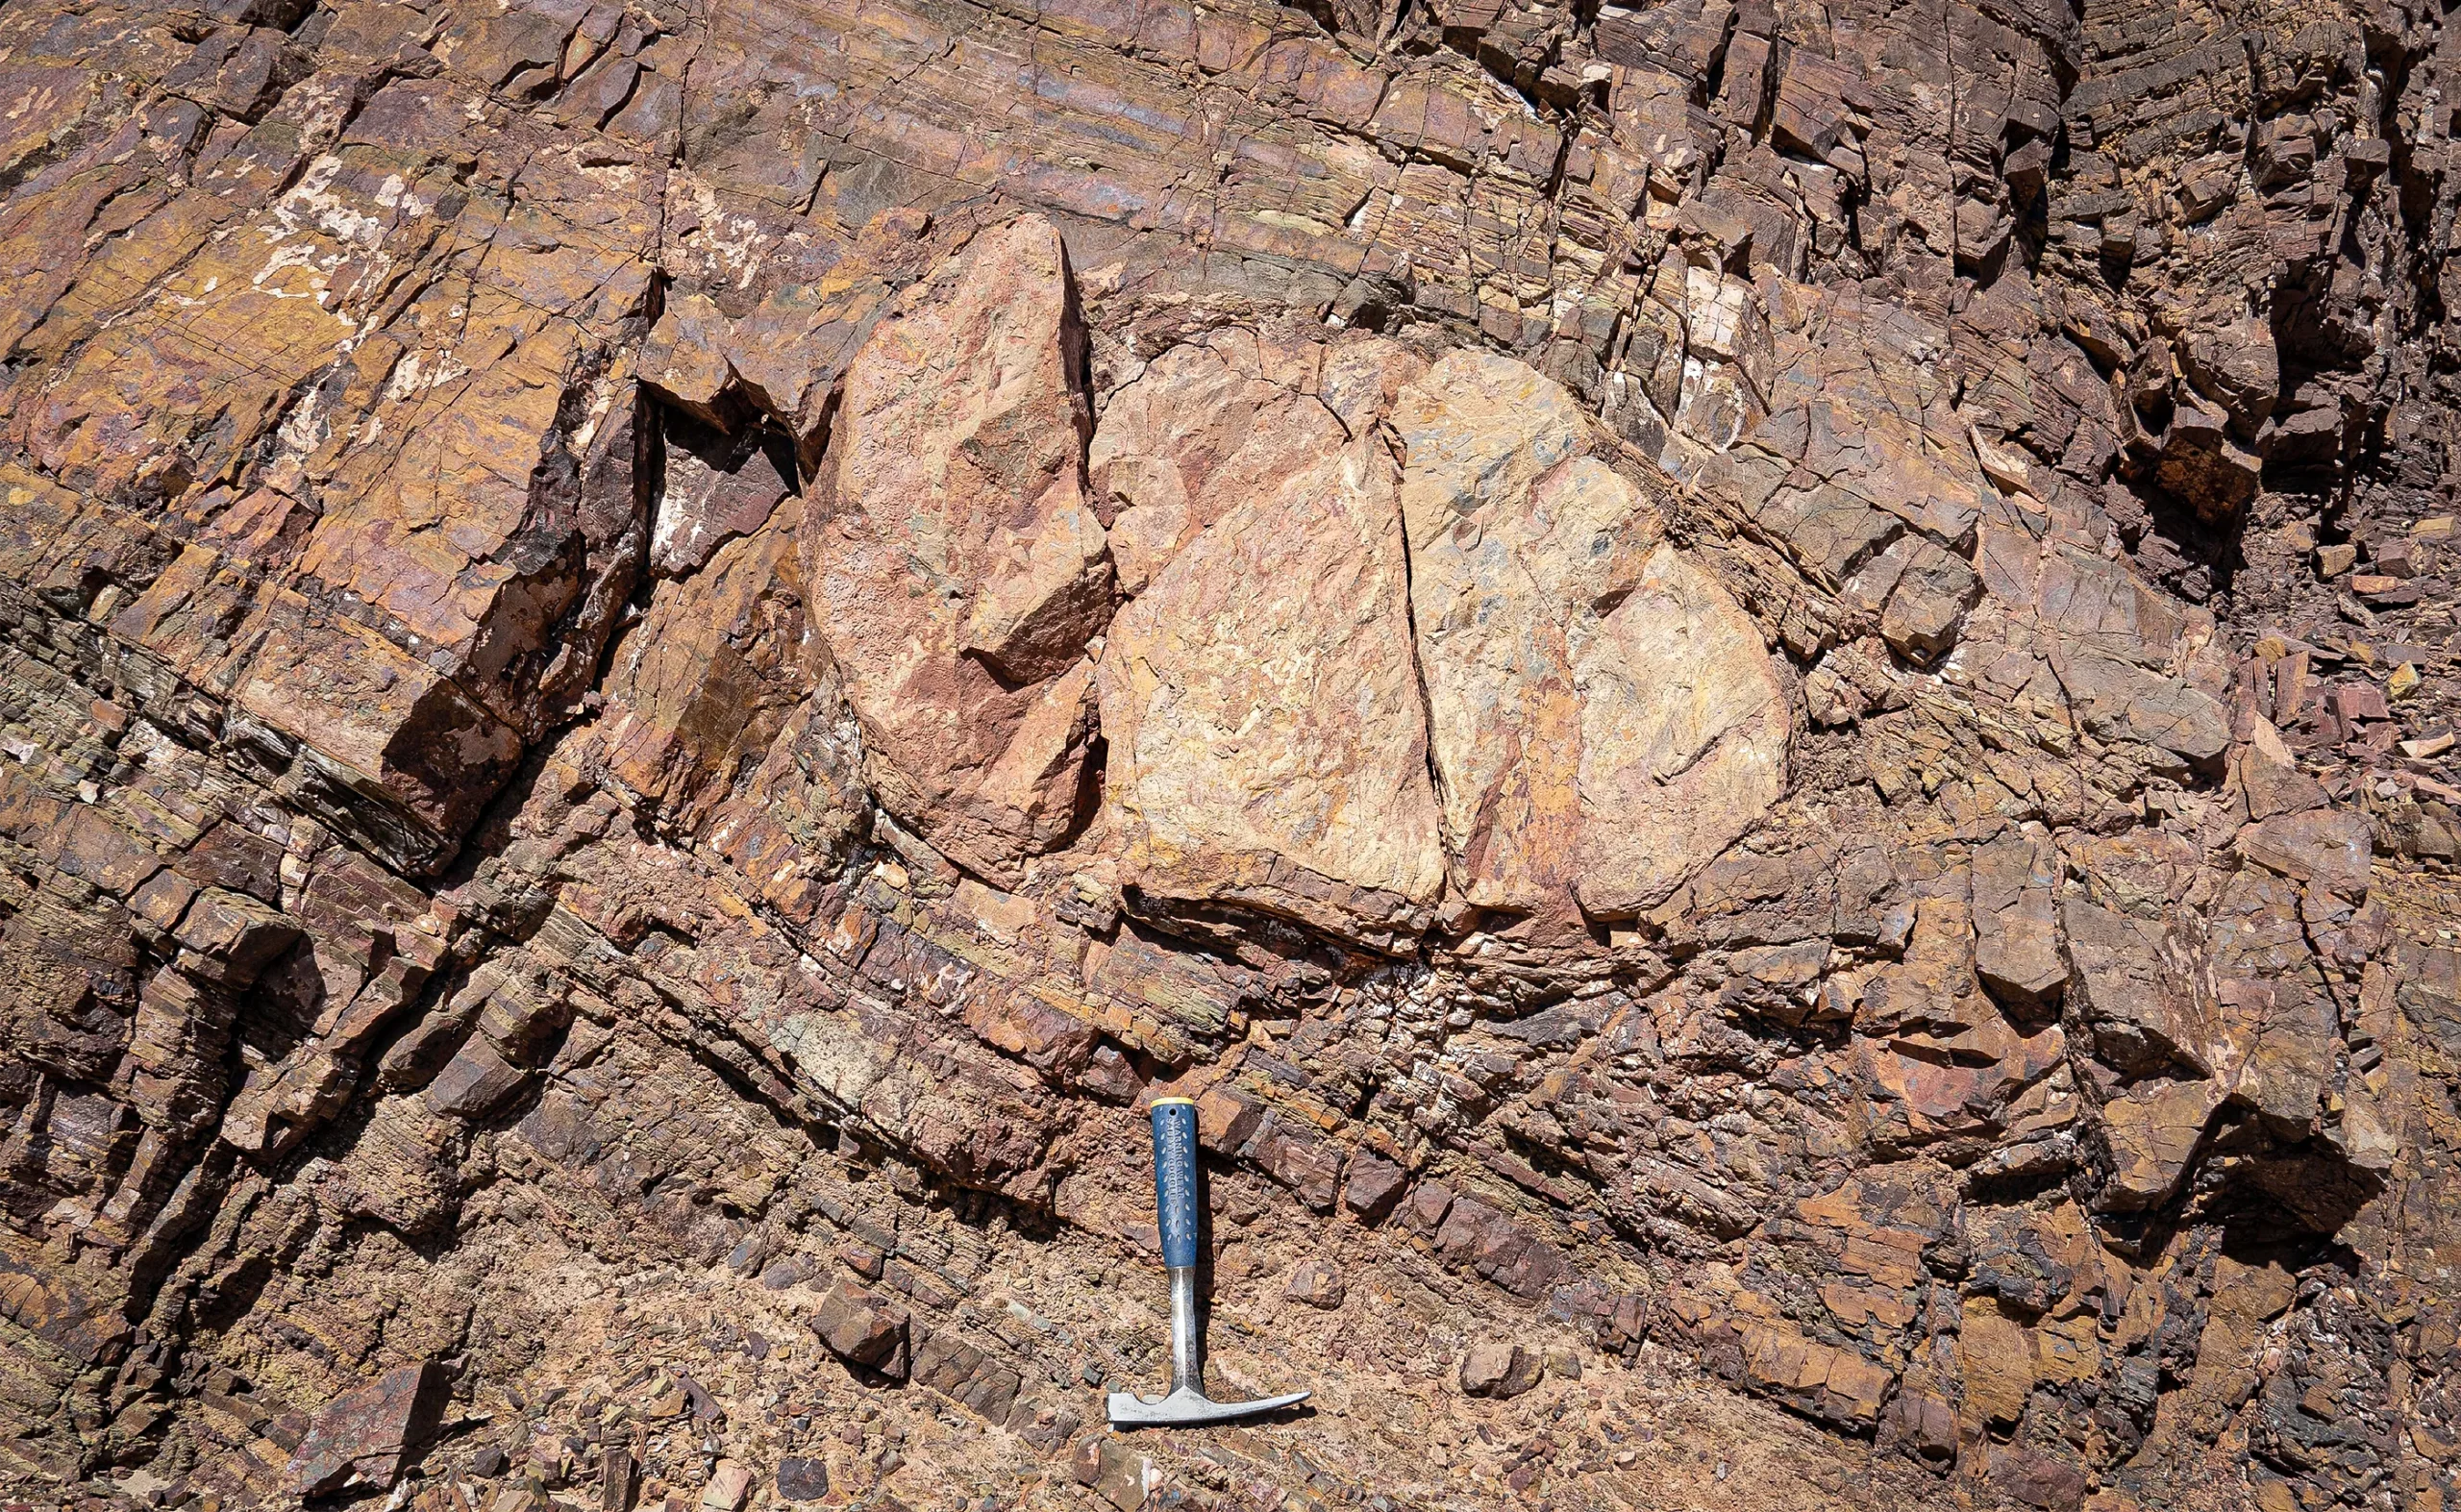
Geological evidence supports the hypothesis that the Earth was once a frozen snowball. Above, siltstone from southeastern California, dated to around 650 million years ago, contains a stone that was likely left there by a glacier.
Marli Miller/Science Source
All these assumptions mean it’s difficult to make predictions, particularly about when a tipping point might occur. “If you’re coming at this from a mathematical perspective, time doesn’t really mean a lot to the system,” said Maya Ben-Yami, a climate researcher at the Technical University of Munich. This is why scientists do not, in general, give a precise date for a tipping point’s arrival. They prefer to benchmark the probability of its occurrence with temperature levels — to say, for instance, that when the global temperature exceeds preindustrial levels by 3 degrees Celsius, there’s a 60% chance of reaching a tipping point.
This is frustrating, because tipping points are the dramatic changes that could be immediately relevant to people today or their children or their children’s children. These are changes that, when posed to us as possibilities, make us most liable to ask: When?
Hitting the Limit
It was perhaps most natural to ask these questions about the Atlantic Meridional Overturning Circulation, or AMOC — one of the best studied of the major tipping points, its behavior the subject of scrutiny for a century. The AMOC is a large current that wobbles across the Atlantic Ocean, driven by salt and heat. Near the equator, the sun bakes the sea, evaporating surface water and leaving salt behind. That warm, salty water then flows northward, where it cools and sinks, eventually turning back south. In the process, the current pumps some 1.2 petawatts of heat — about 100 times the energy produced by humans each year — to Nordic Europe.
If this conveyor belt of warm, salty water were disrupted — say, by an influx of freshwater from melting Greenland ice, or warmer ocean temperatures — the result could be catastrophic. It could freeze fertile landscapes in the British Isles and Scandinavia, disrupt monsoons throughout the tropics and dry out rainforests. Scientists had found evidence that the AMOC is slowing down, but they had largely concluded that a collapse is unlikely to occur this century.
But many researchers, including Peter Ditlevsen, have been observing it closely for signs of unsettling behavior. A few years ago, the University of Copenhagen climate scientist asked his sister, the statistician Susanne Ditlevsen, to take a fresh look at the AMOC data. Just across the campus green, she had been looking into new ways of analyzing highly nonlinear systems, and wanted to apply her techniques to understand how complex systems behave right at the moment of transition. Susanne and Peter planned to test the technique out on AMOC data, assuming they would replicate previous findings about when and how a tipping point would appear.

In 2023, climate scientist Peter Ditlevsen (left) and his sister, the statistician Susanne Ditlevsen, predicted that a system of ocean currents in the Atlantic would reach a catastrophic tipping point in a matter of decades, wreaking global havoc.
Courtesy of Peter Ditlevsen
“We get the first results, and we kind of don’t believe them,” Susanne recalled. “We said, that’s too early. It cannot be so. No!” So they tried again and again, honing their methods each time. The number held. According to their model, a tipping point in the AMOC should occur between 2025 and 2095, with 95% confidence. They expect it in 2057.
When they published their results in 2023, the world took notice. The Ditlevsens made hundreds of media appearances. Coverage frequently invoked the 2004 film The Day After Tomorrow, in which a similar (but fictional) process froze much of the Northern Hemisphere. In response, concerned scientists quickly tried to counter these alarmist takes, directing people’s attention to the caveats, the uncertainties, the limitations. Other scientists came to the Ditlevsens’ defense. The paper soon became the third-most-read in any journal that year.
How do the Ditlevsens explain why one climate-modeling paper attracted so much public attention? “The special ingredient was that we gave [AMOC collapse] a specific year,” Susanne said.
To arrive at 2057, the Ditlevsens made some assumptions. The first was that the AMOC would tip at all. Climate scientists generally agree that the AMOC has experienced bifurcations in the past — repeatedly. The Ditlevsens theorized, based on previous work, that the graph of these states would look like a saddle — a run-of-the-mill sort of tipping, for which it should be possible to find evidence of critical slowing down.
But how would they describe their system? What would their model’s parameters be — their version of the bass and minnow populations varying across time? Because of the size and complexity of the ocean-spanning AMOC, there’s no one good way to measure or represent its strength. Scientists instead look at what are called “fingerprints” — datasets that they believe may reflect aspects of the system’s overall state. The Ditlevsens chose a popular fingerprint involving surface temperatures in a patch of sea southwest of Greenland called the Atlantic subpolar gyre.
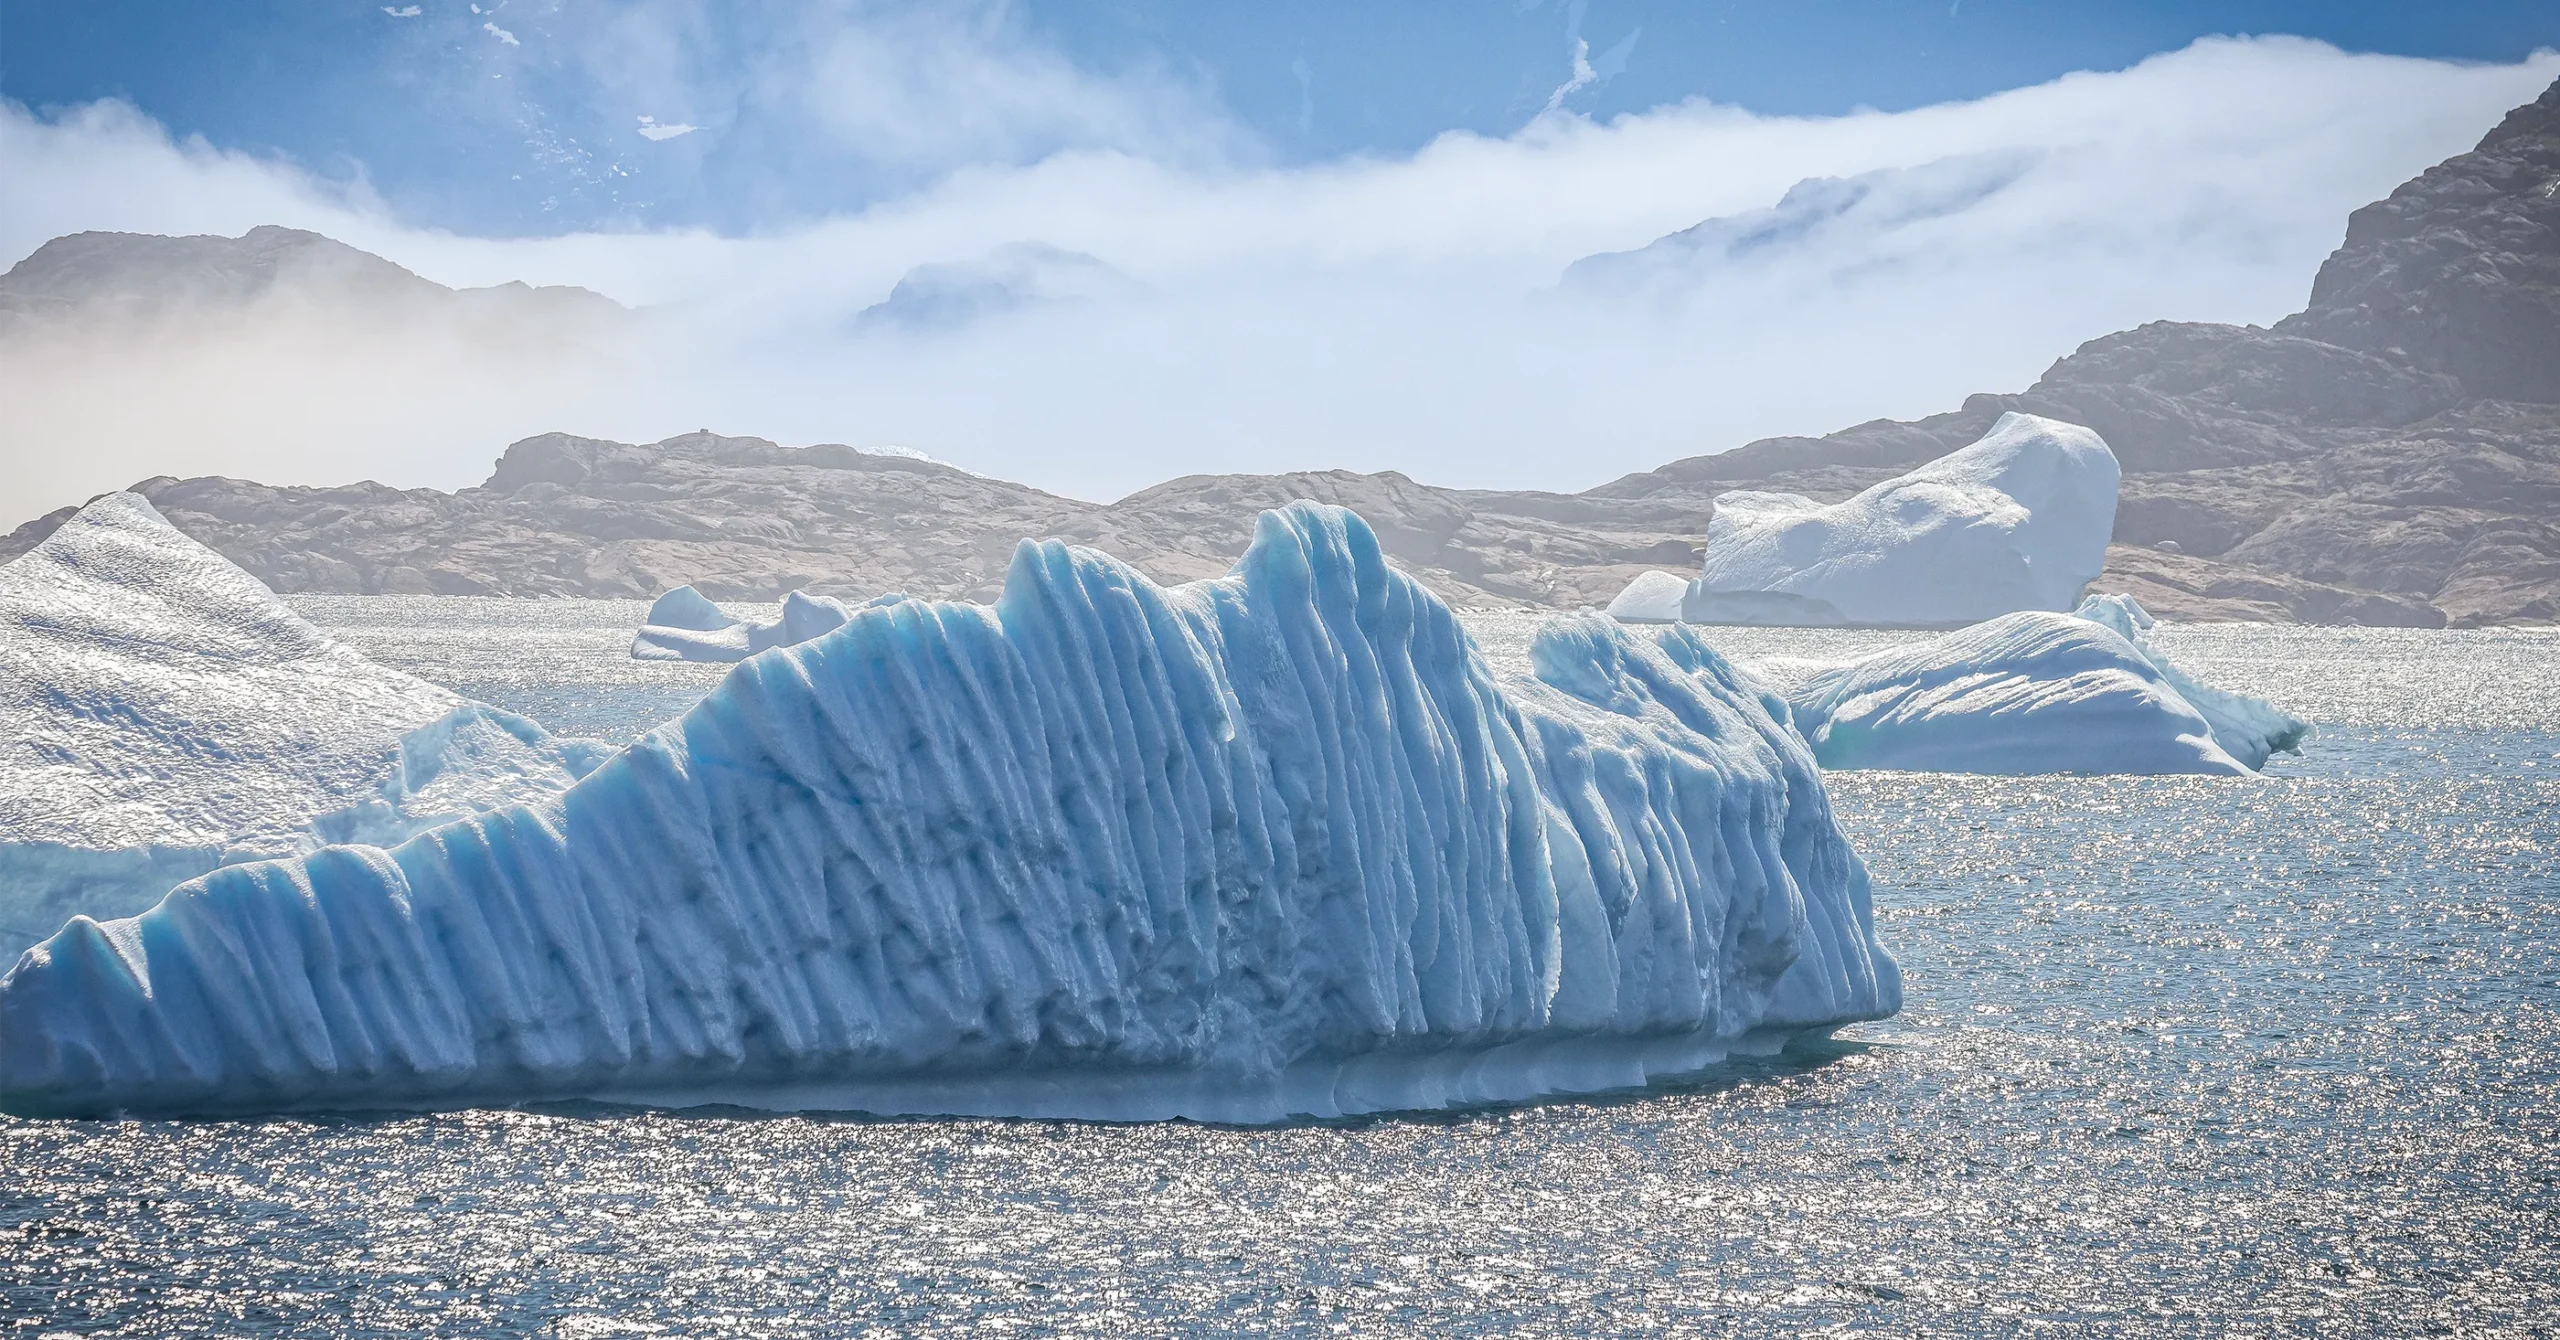
Climate scientists collect data from the Atlantic subpolar gyre, located just southwest of Greenland, to predict how ocean currents might dramatically shift due to global warming.
Nigel Jarvis/iStock
People have monitored those temperatures since the 1870s, when whalers threw buckets into the sea to take rudimentary measurements. But bucket-based readings from 19th-century whalers are, to say the least, a nonstandard dataset, with measurements of dubious accuracy and irregular sampling. And the Atlantic subpolar gyre is just a tiny subsample of the hemispheric circulation. “Of course, that is not the AMOC, but we hope it contains some information about the AMOC,” Susanne said. Nevertheless, the dataset is as good as historical climate data gets; satellite imagery of the Amazon, for example, goes back only to the 1980s. She compared it to dropping your keys on a dark road and looking for them under the streetlamps first: “I’m looking here because here is the light.”
The finding has loomed large over the field of tipping point science. Last year, Ben-Yami published a paper intended as a direct response to the Ditlevsens’ claim, arguing that the uncertainties in the historical data were too great to extrapolate meaningful predictions of the AMOC’s future. “Obviously, the question we want to [answer] is, ‘When will the AMOC tip?’” she said. But a question’s urgency doesn’t mean that science can produce a good answer. “It’s too uncertain,” Ben-Yami said. “It just doesn’t work that way.” If she put away the assumption that the bifurcation would resemble a saddle, or if the subpolar gyre fingerprint was the wrong one or skewed by error, it might push back the collapse date by hundreds or even thousands of years. Many scientists have found evidence that the AMOC is weakening; it’s just not clear when it will tip.
Susanne agreed with many of the critiques, noting that she and Peter have been testing out new fingerprints and correcting potential biases in their data. (So far, she said, they’ve arrived at roughly the same result.) But she didn’t agree that the uncertainties were too great to say anything meaningful about when a cataclysm might arrive.
Maya Ben-Yami searches for early warning signals that the AMOC might tip.
Courtesy of Maya Ben-Yami
“People are saying ‘alarmism,’ but I think that is a weird thing to say, because things are as they are. With the knowledge that we have today, we cannot rule out a total collapse,” Susanne said. Still, she recognizes that her model is not the only one out there — that it presents just one possible future, among many, to consider. “We might be wrong,” she said. “I hope we are wrong. But we have to report what we find.”
A New Direction
Whatever you might think about the accuracy of the Ditlevsens’ predictions, you need a different type of model to describe the specific climatic changes that will occur after a tipping point is reached. While the historical record appears to record bimodal states — AMOC on or off, a planet frozen or warm, the Sahara dry or wet — there could be more ways to tip. A complex system might reorganize into a whole range of different states. That means that even if the specific predictions are to be believed, “we can only see that we are probably approaching a tipping point,” Susanne said. “In the last 150 years, the AMOC has not been in the collapsed state, so we have no information about the collapsed state. We cannot do magic.”
There is a version of AMOC collapse that suggests a total disaster. But early warning signals could also indicate a partial collapse of the current, or a new set of dynamics that don’t spell out doom at all. “It’s not like the AMOC collapses or it doesn’t. It’s a bunch of states,” Lucarini said.

The Sahara Desert was a vibrant grassland 6,000 years ago. Then it hit a tipping point that pushed it into a different equilibrium state: the arid desert it is today.
Patrick Poendl/iStock
These states form a much more complicated landscape, one in which the shapes of tipping points no longer resemble the familiar saddles and cones. To make sense of these dynamics, researchers have been exploring methods both old and new. They’ve turned back to the long history of bifurcation theory, studying the nature of bifurcations in other complex physical systems (such as turbulent fluids) to infer what various climate scenarios might look like after tipping has occurred. They’ve started using machine learning tools to uncover new relationships between variables. All in all, these efforts involve simplifying less — adding greater detail back into their models, greater sophistication into their techniques.
More possibilities. More complexity. More reasons to say that nothing is for sure. But perhaps also a more realistic picture of what could happen.
Perhaps it’s futile to produce more predictions that add to the “scary bucket,” as Ben-Yami put it, without also offering clarity. Still, she said, ignoring tipping points is not an option. At a basic level, what tipping point models show, regardless of their uncertainties, is that stability in the Earth’s climate is not something to be taken for granted. Our climate is not preordained to remain hospitable forever. So why chance it?
“This whole debate feels a bit fruitless sometimes, because we know what we need to do to avoid the tipping elements, right?” Ben-Yami said. “It’s not rocket science. You just need to reduce carbon emissions. The answer is never going to be anything different.”

If disrupted, the AMOC could cause temperatures to plummet across Northern Europe, even as the rest of the planet continues to warm. Winters in Norway, as seen above, would become far more extreme.
Uwe Moser/iStock
To that end, some experts, including Scheffer and Lenton, have recently started identifying “positive tipping points” in models of renewable energy use, electric vehicle markets and green social movements. Once enough electric vehicles get on the road, for instance, they’ll get better and cheaper, causing more people to use them — a self-propelling cycle. In a paper published in August, Lenton and his colleagues identified many such tipping points, while taking care, they wrote, to avoid “wishful thinking about their existence, or oversimplification of their nature.” Sometimes these tipping points arrive at a national scale, such as in the elimination of coal power or the uptake of offshore wind. Other times they can be triggered by individual behavior, if a “critical mass” of adopters suddenly makes a new behavior or technology more attractive.
The idea is that sudden and potentially irrevocable change can be a good thing, too. Are these all mathematically proper bifurcations? Perhaps not. But such is the beauty of a concept that is a little vague. The intuition about what it means is there. This time it’s a hopeful message, grounded in math.