Fed on Reams of Cell Data, AI Maps New Neighborhoods in the Brain
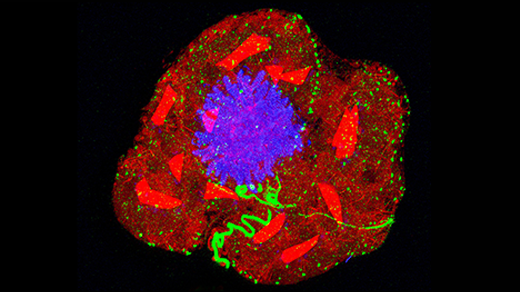
A machine learning algorithm created maps of the mouse brain with 1,300 subregions by predicting how brain cell types tend to group together, like buildings in a neighborhood.
Irena Gajic for Quanta Magazine
Introduction
Real estate agents will tell you that a home’s most important feature is “location, location, location.” It’s similar in neuroscience: “Location is everything in the brain,” said Bosiljka Tasic, a self-described “biological cartographer.” Brain injury in one spot could knock out memory; damage in another could interfere with personality. Neuroscientists and doctors are lost without a good map.
Researchers have been mapping the brain for more than a century. By tracing cellular patterns that are visible under a microscope, they’ve created colorful charts and models that delineate regions and have been able to associate them with functions. In recent years, they’ve added vastly greater detail: They can now go cell by cell and define each one by its internal genetic activity. But no matter how carefully they slice and how deeply they analyze, their maps of the brain seem incomplete, muddled, inconsistent. For example, some large brain regions have been linked to many different tasks; scientists suspect that they should be subdivided into smaller regions, each with its own job. So far, mapping these cellular neighborhoods from enormous genetic datasets has been both a challenge and a chore.
Recently, Tasic, a neuroscientist and genomicist at the Allen Institute for Brain Science, and her collaborators recruited artificial intelligence for the sorting and mapmaking effort. They fed genetic data from five mouse brains — 10.4 million individual cells with hundreds of genes per cell — into a custom machine learning algorithm. The program delivered maps that are a neuro-realtor’s dream, with known and novel subdivisions within larger brain regions. Humans couldn’t delineate such borders in several lifetimes, but the algorithm did it in hours. The authors published their methods in Nature Communications in October.
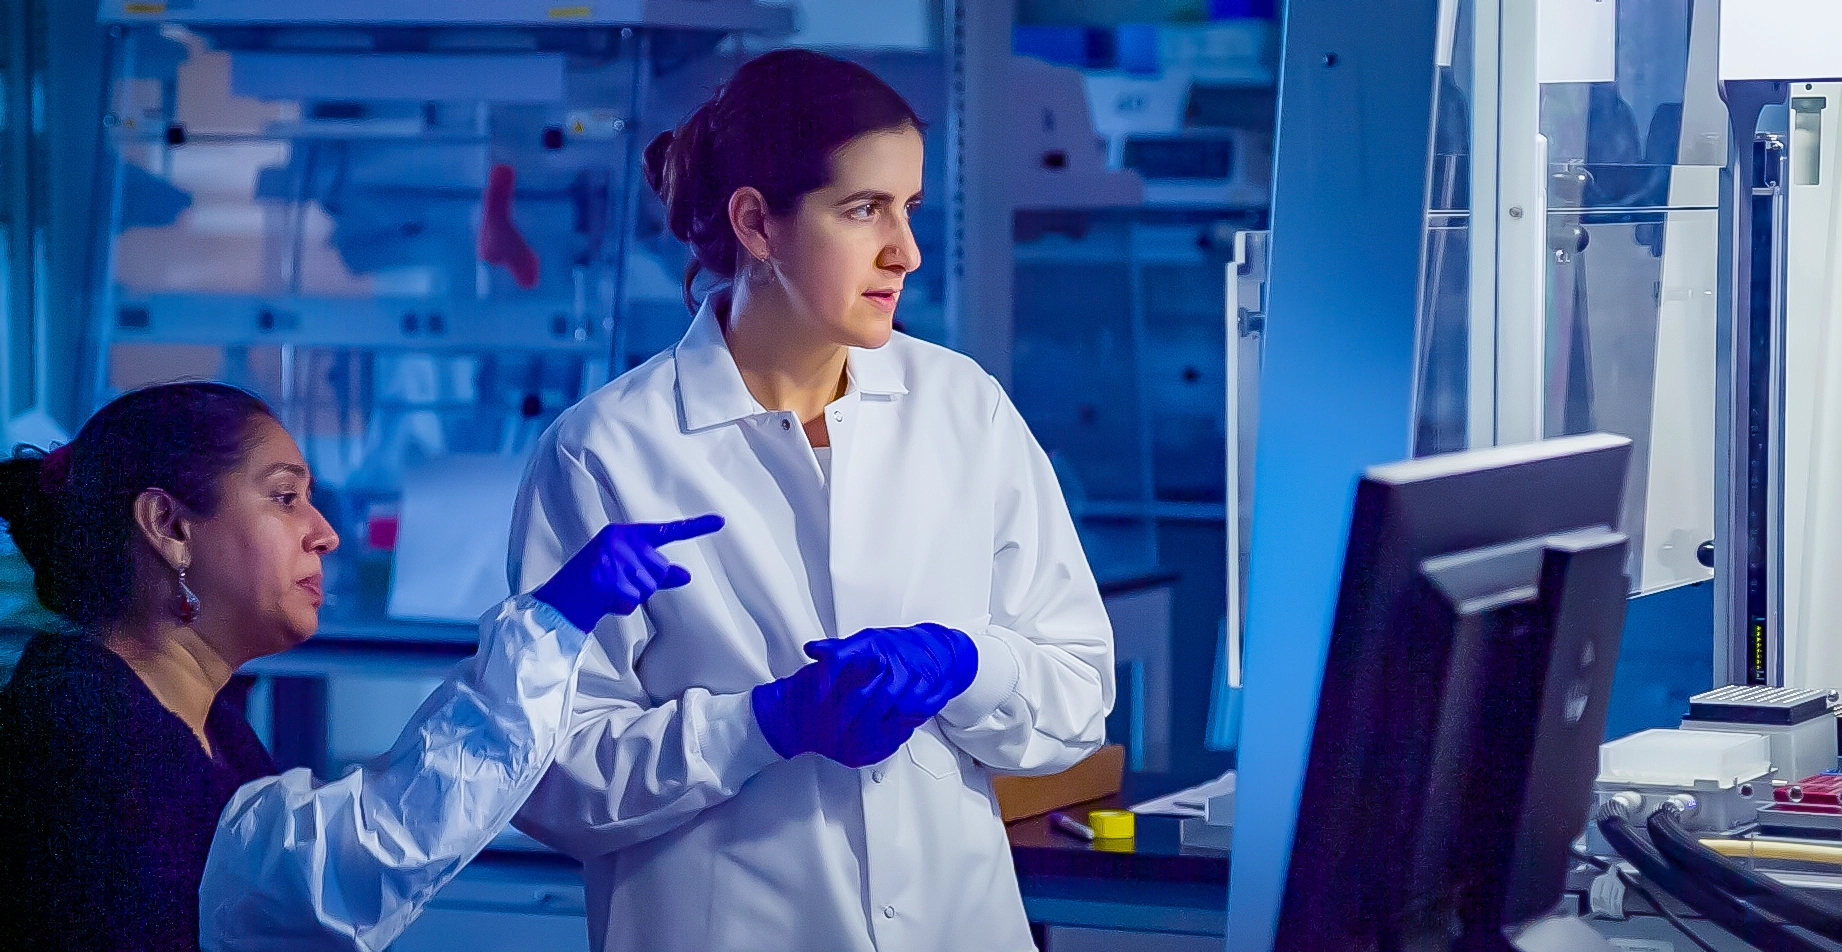
Bosiljka Tasic, a neuroscientist, genomicist, and self-described “biological cartographer,” used AI to sort through reams of cell data and build new maps of the mouse brain.
Erik Dinnel/Allen Institute
By applying the same technique to other animals and eventually to humans, researchers hope not only to detail the brain’s finer-grained layout but also to generate and test hypotheses about how the organ’s parts operate in health and disease.
“We want to understand how the cells are organized in 3D space,” said Claudia Doege, a neuroscientist at Columbia University who wasn’t involved in the study. “Only if we know how they are organized can we figure out how they can potentially work with each other.”
Neural Cartography
Brain mapping is an old science, dating back to the early 1900s when the German neuroscientist Korbinian Brodmann defined regions of the cerebral cortex — the outer, thinking part of the brain. He stained human brain slices with a dye that turned genetic material violet and then studied them under the microscope, where the densities and arrangements of brain cells produced different, observable textures. He traced the borders to create a map of 52 regions, known as Brodmann areas, some of which are still recognized today.
For decades, brain-mapping scientists wielded tools little more advanced than Brodmann’s, said Yongsoo Kim, a neuroanatomist at Penn State College of Medicine. “What anatomists used to do is, they have a pencil, and they draw the line” between different-looking regions on brain images, he said. One such map, the Allen Mouse Brain Common Coordinate Framework, which was published in 2020, was based on data from 1,675 mouse brains and includes more than 1,000 different areas. Such maps are undeniably valuable but also inevitably subjective: When Kim asked senior scientists to impart the secrets of their methods, he said the answer was often, “It’s all in my head.”
Recently, more advanced molecular techniques have allowed neuro-cartographers to investigate individual cells. Under this framework, a cell’s identity is determined by which of its tens of thousands of genes are turned on, something that can be represented by the sequences of RNA molecules (copies of active DNA regions) present in the cell. Thus, scientists can slice up a brain, measure the RNAs from each cell, and then map those genetic patterns back to the cells’ original locations.
This approach has distinguished thousands of individual types of brain cells, many more than previously known. The Allen Institute’s latest mouse brain atlas, published in 2023, includes more than 5,000 different cell types. The first-draft Human Brain Cell Atlas, based on 3 million cells from the brains of three deceased people, defines 3,313 cell types.
But those massive datasets didn’t yield the kind of brain cartography that Tasic sought. The resulting maps generated regions that weren’t always “biologically meaningful,” she said. That’s because most brain regions aren’t defined by a single cell type, and many cell types aren’t limited to one region. Instead, each area contains a mixture of cell types, including different kinds of nerve cells plus the brain’s support and immune cells.
“Only if we know how [cells] are organized can we figure out how they can potentially work with each other,” said Claudia Doege, a neuroscientist at Columbia University.
Courtesy of Claudia Doege
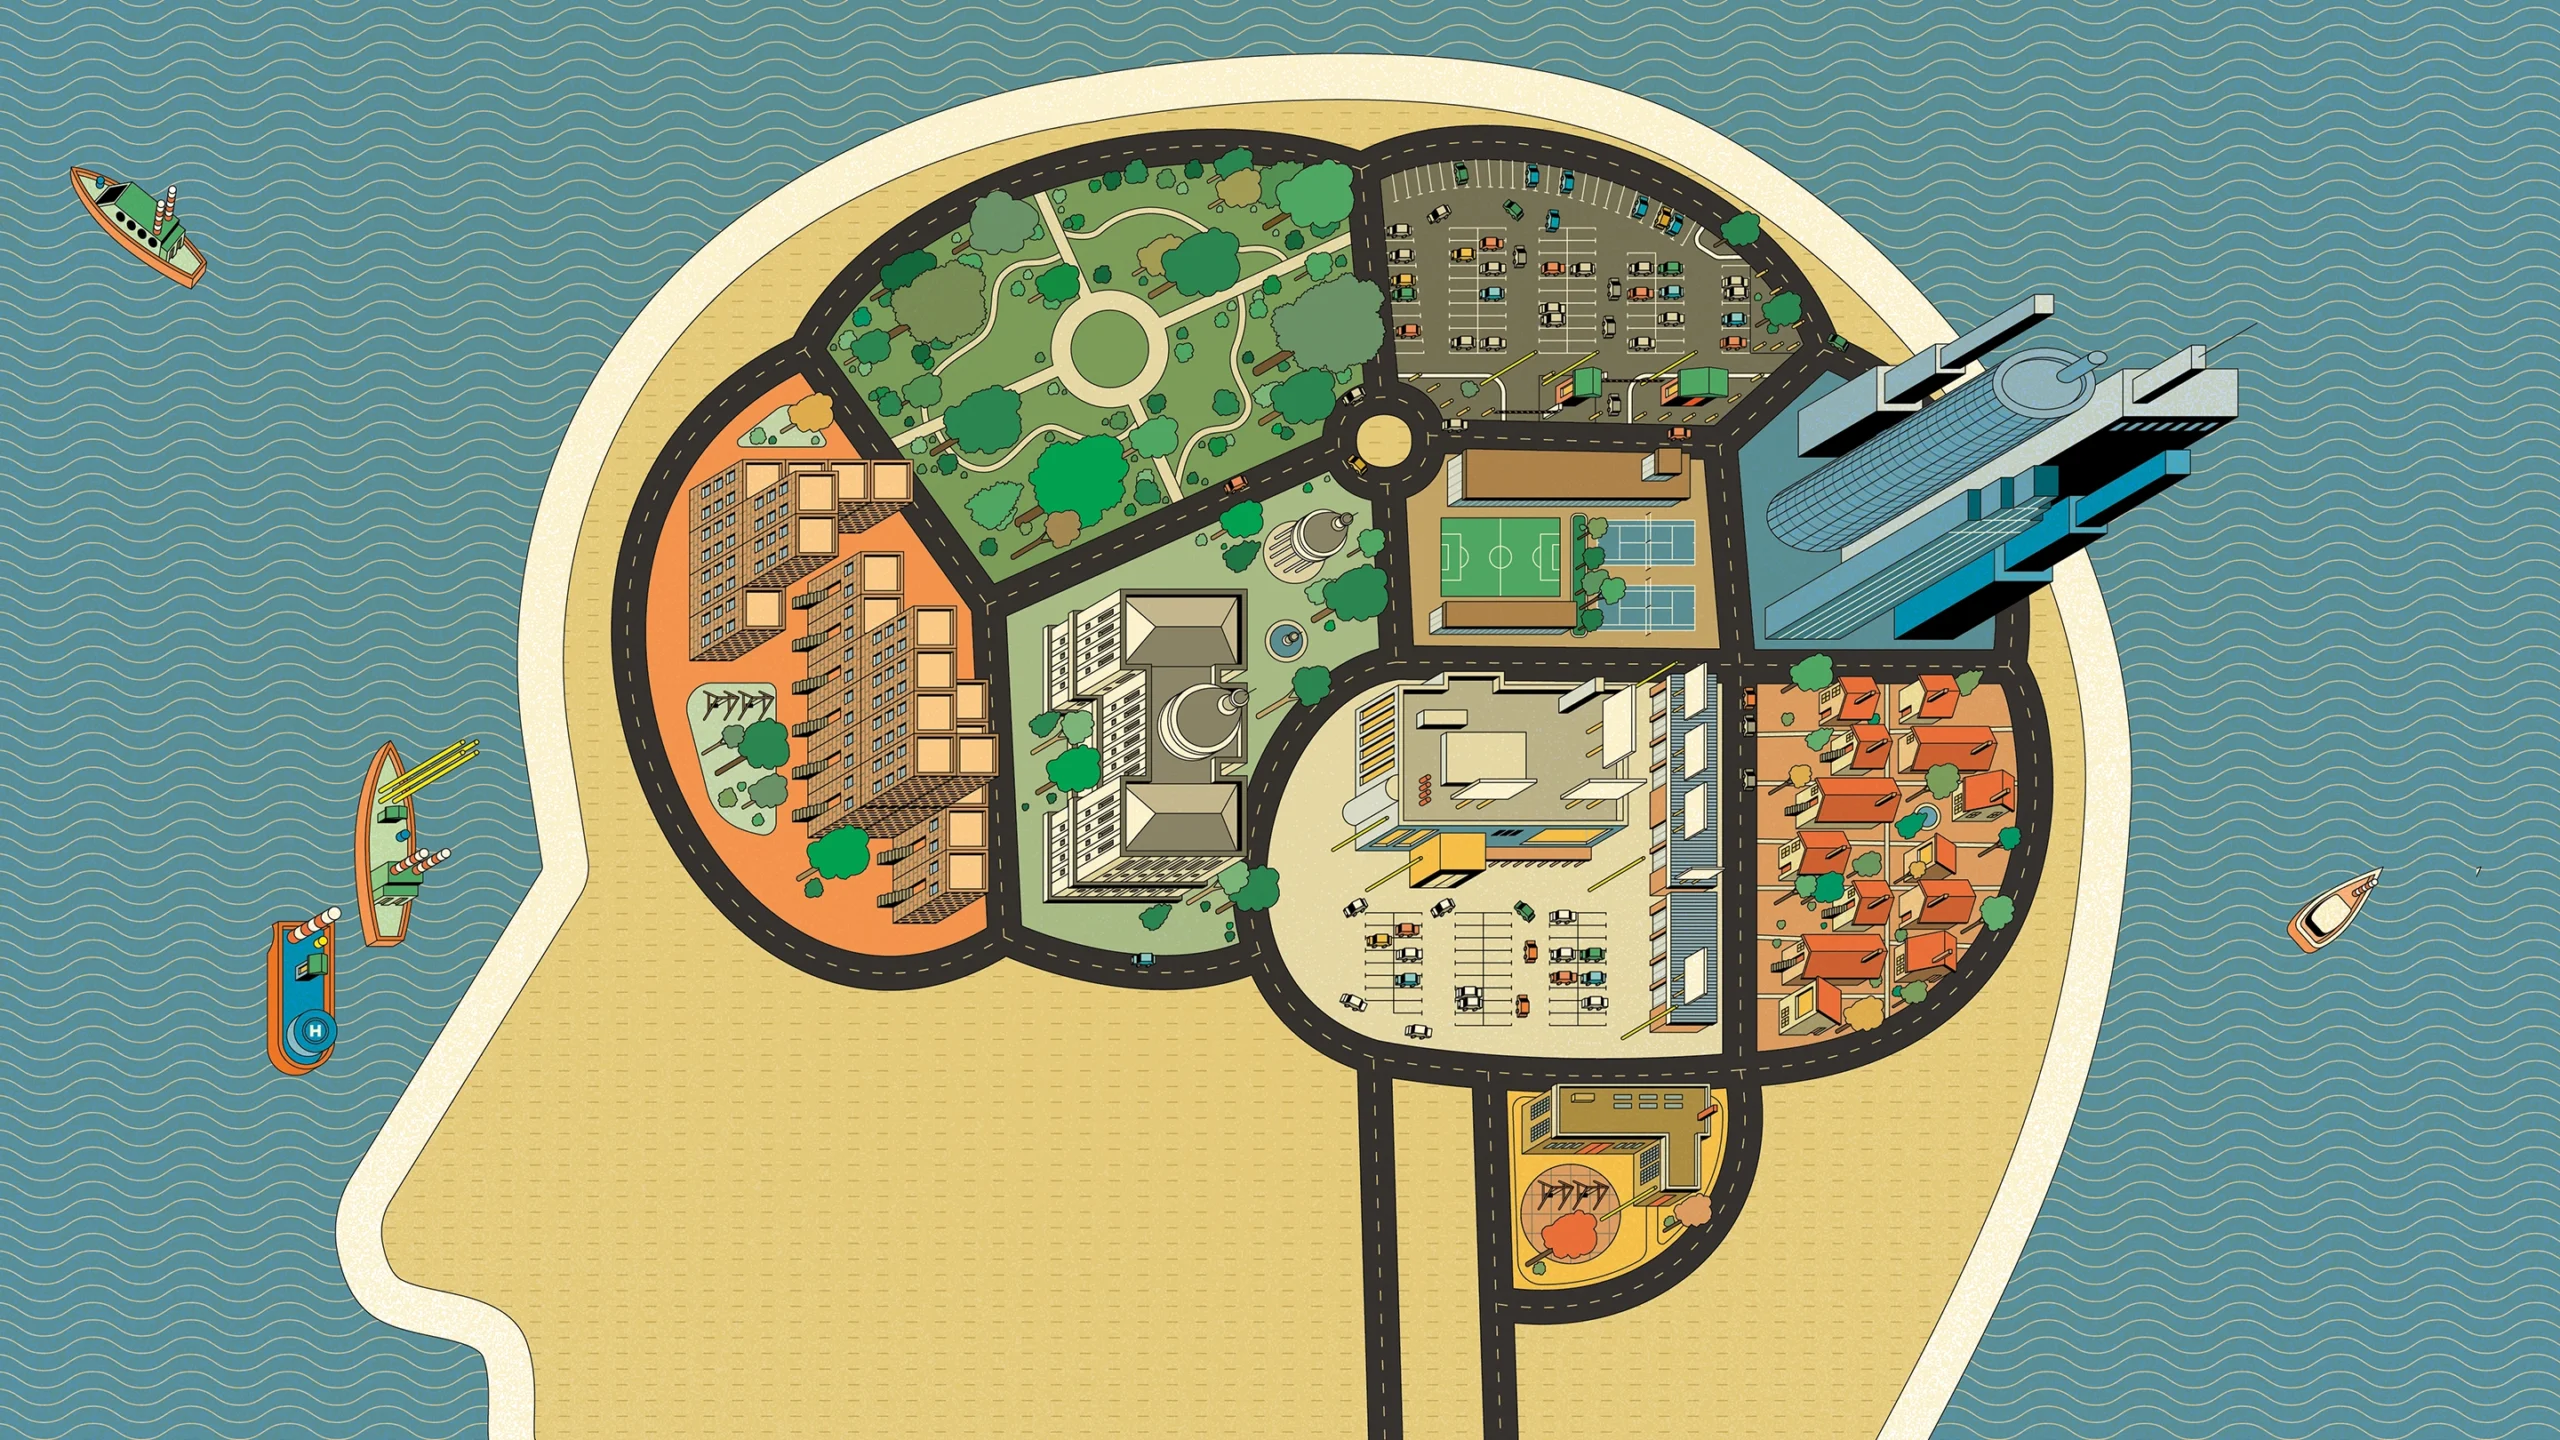
For comparison, imagine an airplane passenger looking out the window and trying to identify neighborhood boundaries within a city below. If the passenger focuses on just one building at a time, they can’t discern its surroundings. To identify neighborhoods, they need to focus on how different building types group together: One neighborhood might be crowded with brownstones and playgrounds, another could be populated by mostly larger apartment buildings and bodegas, a third might be full of high-rise office complexes and restaurants.
To map the brain’s subregions, Tasic needed to analyze how different cell types grouped together. That’s not something her human brain, for all its glorious complexity, could do on its own by studying the RNA data.
Tasic needed better computational tools — and a research partner.
Neighborhood Watch
Tasic found the perfect collaborator in Reza Abbasi-Asl, a computational neuroscientist at the University of California, San Francisco. “I have always been fascinated and intrigued by how we can leverage AI to understand cellular organization in the brain,” he said.
To define cellular neighborhoods, Abbasi-Asl and his graduate student Alex Lee started with RNA profiles collected from 3.9 million cells in a single mouse brain. They programmed a machine learning algorithm to choose one cell; its identity and gene expression would be masked. Then the AI, which they called CellTransformer, would predict that cell’s gene expression and type based on those of its neighbors, check if it had guessed right, and update its algorithm based on the result. By repeating this process millions of times, the algorithm learned how and where different types of brain cells group together. From there, it could build a high-resolution map of those groups.

Reza Abbasi-Asl (left) and Alex Lee at UCSF programmed a machine learning algorithm to find out how brain cell types tend to cluster together for neurobiological mapmaking.
Abbasi Lab at the University of California, San Francisco
Returning to that airborne city observer, what CellTransformer does is the equivalent of holding up a thumb to the window to block one building, and then predicting its type. The surroundings provide clues as to what kind of structure fits into the neighborhood.
Approaching brain mapping as relationships between nearby cells was the “secret sauce,” Abbasi-Asl said, that allowed the algorithm to map out meaningful neural neighborhoods, each made of a blend of different cell types. Depending on the level of granularity the scientists asked for, it could define anywhere from 25 to 1,300 neighborhoods in the mouse brain, though that’s not necessarily the upper limit of brain regions. With AI, “we see things that a human eye cannot see,” Tasic said.
Using single-cell RNA data from four additional mouse brains — including ones from male or female mice, and ones sliced from left to right or front to back — CellTransformer produced similar maps. This, Doege said, is excellent evidence that the technique is reliable.
While the algorithm used its predictions to group cells, it wasn’t generating wholly new maps, so it couldn’t hallucinate as some generative AI models can. Nonetheless, it was essential to compare CellTransformer’s novel output to known brain maps. As a trusted comparator, the team returned to the hand-drawn Allen Mouse Brain Common Coordinate Framework. The CellTransformer map was a good match, laying out similar structures such as the layers in the cortex.
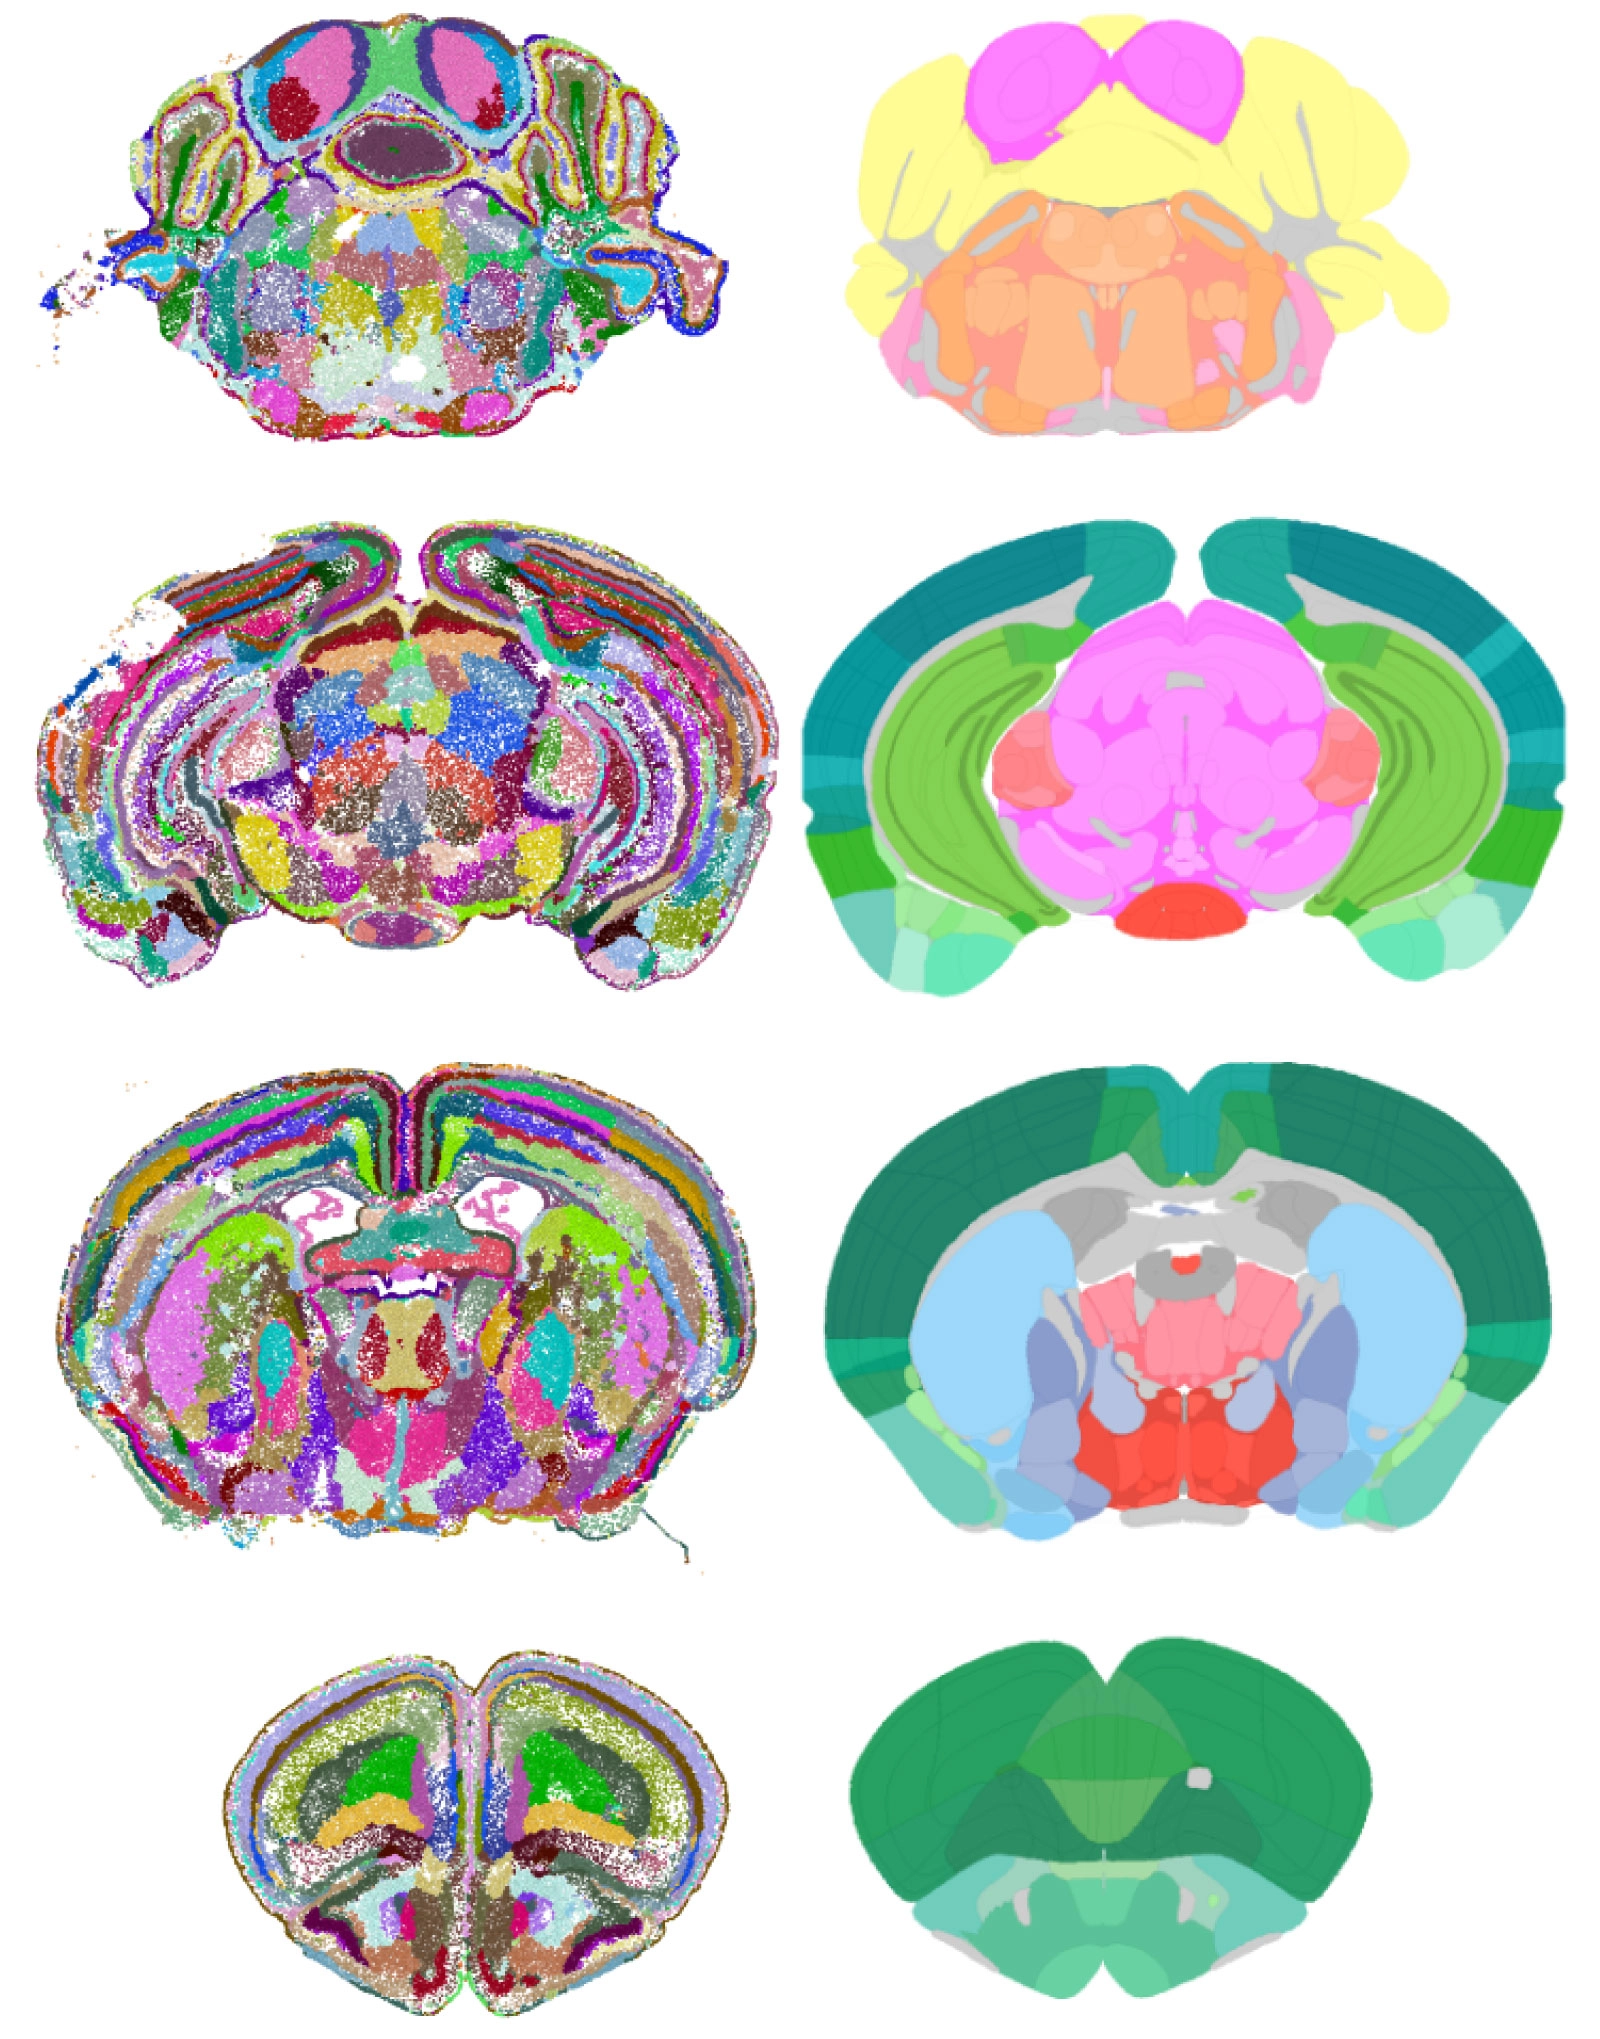
Mouse brain maps created by the AI CellTransformer (left column) and by human scientists with the Mouse Brain Common Coordinate Framework (right column). Both located more than 1,000 cellular subregions in the brain (the AI found more).
Abbasi Lab at the University of California, San Francisco
The algorithm was also able to identify new neighborhoods, regions that previous neuroscience methods, including the Allen Mouse Brain Common Coordinate Framework, had missed. Take the striatum, a striped, vaguely C-shaped structure near the middle of the brain. In maps of the mouse brain, where the striatum is called the caudoputamen, “you just see one huge structure,” said Hourig Hintiryan, a neuroanatomist at the University of California, Los Angeles who wasn’t involved in the new project. It’s known to participate in movement, reward, and overall brain management. How could one piece of brain perform such disparate tasks?
CellTransformer’s explanation is that it’s not one uniform brain region after all. The map confirmed that the caudoputamen is, in fact, subdivided into smaller areas, although researchers have not yet matched each region to a function. Moreover, the new subdivisions corresponded nicely to a map that Hintiryan and colleagues published in 2016 based on an entirely different technique, which traced connections between the caudoputamen and other regions.
Identifying such subregions across the brain, Hintiryan said, could resolve debates between neuroscientists who assign vastly different functions to the same large brain region. It seems likely that “they’re both correct, they’re just looking at different areas,” she said.
Abbasi-Asl and Tasic were thrilled with CellTransformer’s ability to accurately match known brain cartography, and even more excited that the algorithm mapped novel subdivisions. For example, the brainstem’s midbrain reticular nucleus, which is involved in initiating movement, is a fairly underexplored region, Abbasi-Asl said. CellTransformer picked out four new neighborhoods there. Each of those neighborhoods featured particularly prevalent cell types and specifically activated genes. They also had several cell types that earlier analyses had placed in an entirely different part of the brain.
A Map in Hand
The Nature Communications paper serves mainly to introduce the CellTransformer method and show that it can find novel regions; the thousand-plus new neighborhoods still require validation. As with any exploration of new territory, drawing the map is just the beginning. What’s most exciting is what scientists may be able to do with it. “The more granular our understanding of structure, the more specific we can get with our interrogations and interventions,” Hintiryan said.
Emerging questions center on the functions of all these neural neighborhoods. To pinpoint what each bit does, scientists could eliminate or activate these newly identified regions in lab animals and then check for behavioral changes.
The real prize will be to apply CellTransformer to human brains. Doege suspects that some neighborhoods will match well between mice and people, while others will diverge. Unfortunately, the quantity of data the algorithm needs to make accurate predictions isn’t available from human brains — at least, not yet. While the mouse brain contains about 100 million cells, the human brain has around 170 billion, and that menagerie is still undergoing genetic analysis. When sufficient amounts of that data become available, Abbasi-Asl and Tasic think CellTransformer will be up to the challenge.
They are also interested in incorporating other technologies, such as the connection tracing used by Hintiryan, into CellTransformer. This would be like adding streets and highways to the city neighborhoods. And beyond the brain, the same algorithm could offer detailed cell maps of other organs, allowing scientists to compare, for example, healthy versus diabetic kidneys.
Human scientists simply can’t sort out these details on their own. “I see AI as kind of a helper for the human,” Kim said. “Discovery will be accelerated in a dramatic way.”