Mark Belan/Quanta Magazine
Introduction
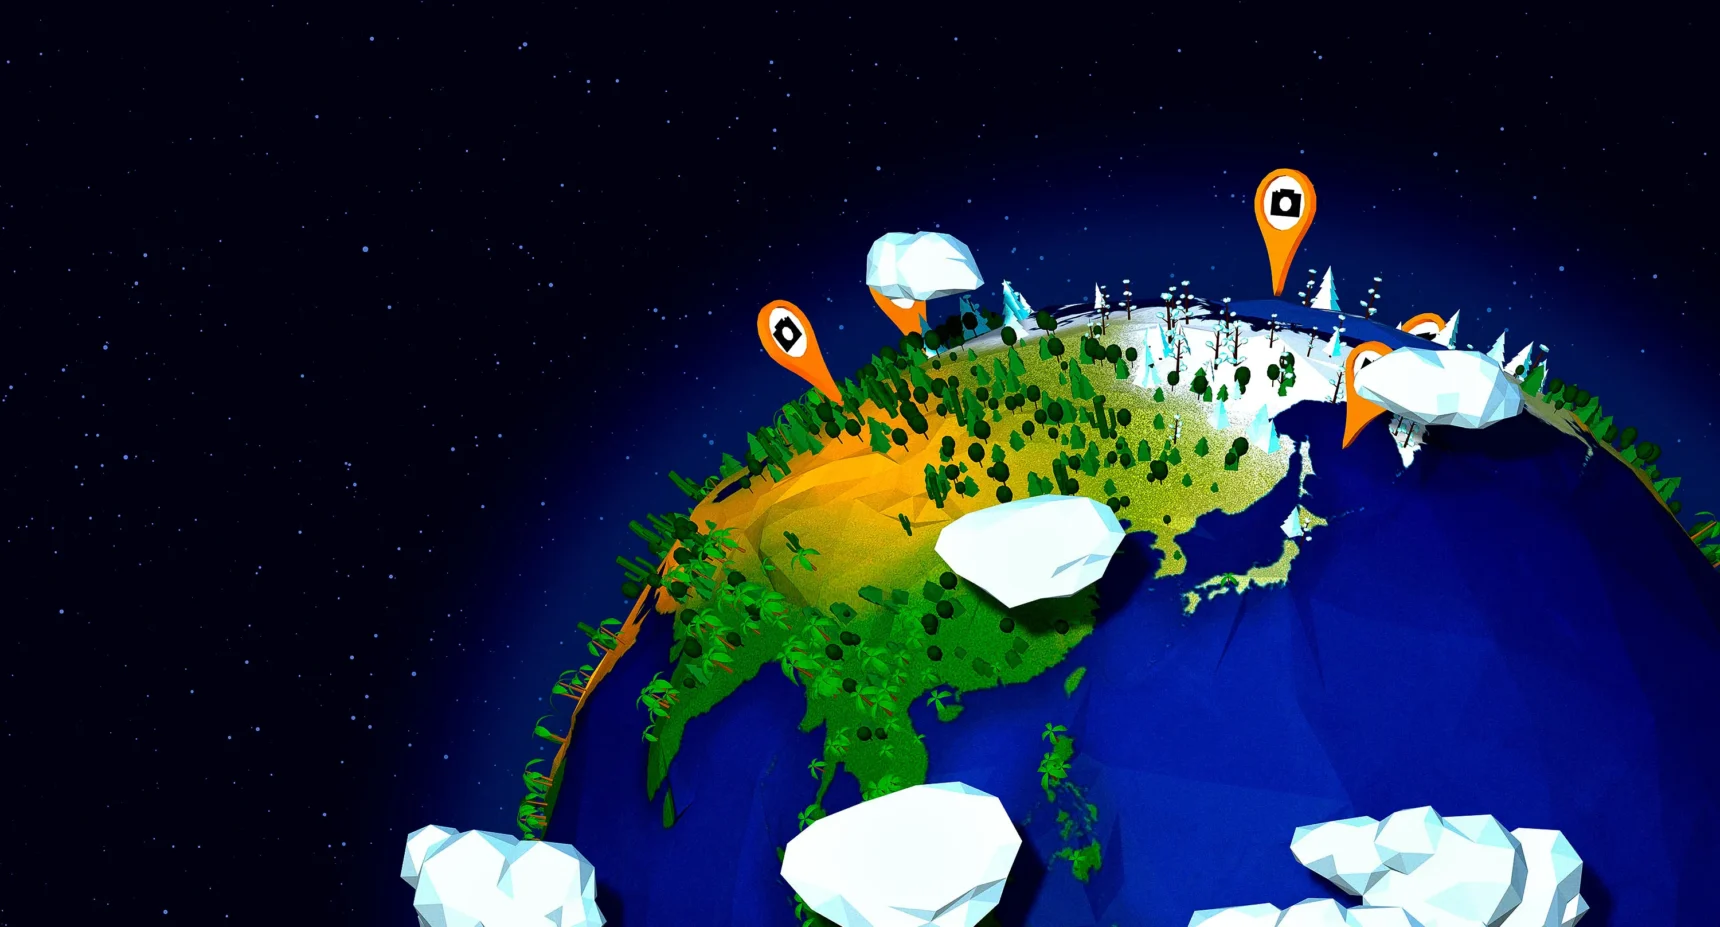
Nearly 170 years ago, a scientist named Eunice Foote discovered a fundamental truth about the gases that surround us. In her home laboratory in New York, she filled one glass cylinder with carbon dioxide and another with regular air, placed a thermometer in each and left them out in the sun. Less than 20 minutes later, the carbon dioxide–filled cylinder was much warmer — and much harder to cool down — than the other one. Foote concluded that carbon dioxide traps heat and theorized that “an atmosphere of that gas would give to our earth a high temperature.” Several years later, the Irish physicist John Tyndall independently confirmed her results, and found that ozone and water vapor also trap heat. These early experiments were the overture to what would become the most monumental — and most frustrating — scientific undertaking ever: understanding, characterizing and modeling Earth’s climate system.
What started as a simple chemistry experiment has grown to include geologists, physicists, computer scientists, mathematicians, biologists, meteorologists, archaeologists — and eventually climate scientists, a new kind of researcher. They work at desks or in the field, measuring, gathering and computing the astronomical amounts of information needed to understand how Earth’s land, sea, ice, atmosphere and life interact on local, regional and global scales. They’re extracting sediment from the seafloor to uncover ancient climate patterns, diving to track coral survival after heat waves, and flying drones into clouds and volcanoes. Workers at remote stations around the world are continuously tracking temperatures and air composition. Volunteers are documenting changes in bird populations and archaeological sites.
All this data on minerals, molecules, temperatures, ice, currents and more is woven into models, projections and reports. “Climate science has always required, by its very nature, collaboration,” said Andrew Weaver, a climate scientist at the University of Victoria in Canada. “If you sit in your silo, that’s not going to solve anything.”
Together, these efforts have shown us wondrous, surprising, harrowing things. They reveal that we are living in a rare temperate, stable climate period from which human civilization emerged. This window nurtured human creativity, ingenuity and industry, all of which are now driving an unprecedentedly rapid change to Earth’s atmosphere and all it supports. Climate science is also driving new ideas and strategies to compensate for our self-inflicted wounds.
None of this has been easy. Climate scientists have faced not only extreme working conditions, but also antagonistic political movements that reject their findings and attempt to defund their work entirely. Still, the desire to understand the planet compels them to keep putting on their snowsuits, their wet suits, their business suits. It motivates them to climb to the top of tall observatories or live on a piece of floating ice for months at a time. They show up so that polar bears, corals, birds and even the policymakers who resist their discoveries will continue to have a stable climate to live in.
And when they have a second to breathe, surrounded by a lush green forest or white ice as far as the eye can see, they admire the beauty of a planet that they don’t fully understand. Through the haze of doom that shrouds climate science shines the passion behind the quest to understand and solve one of the greatest challenges humanity has faced.
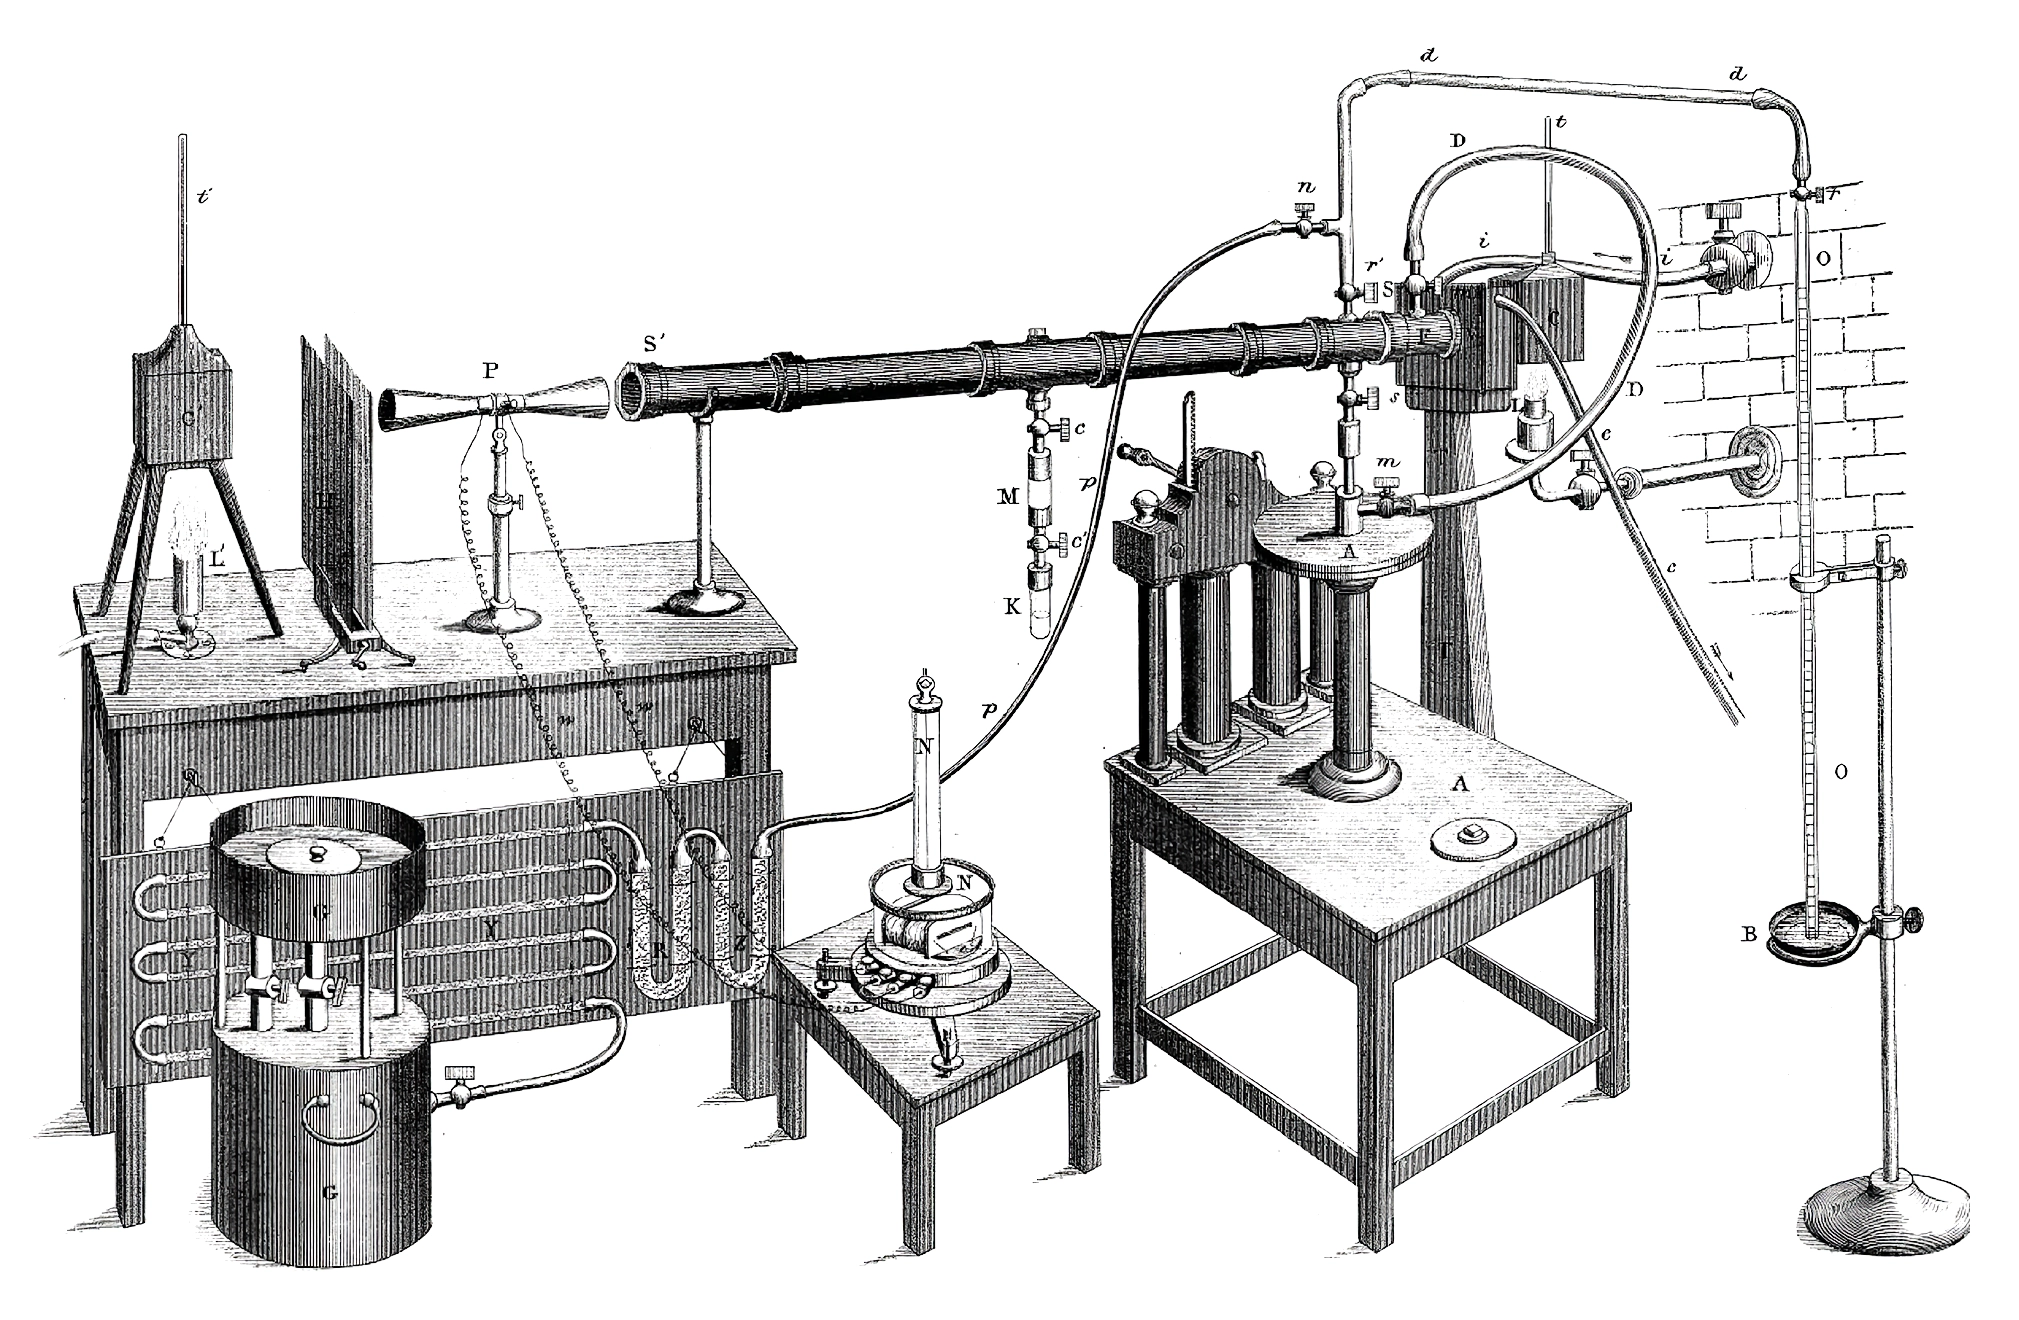
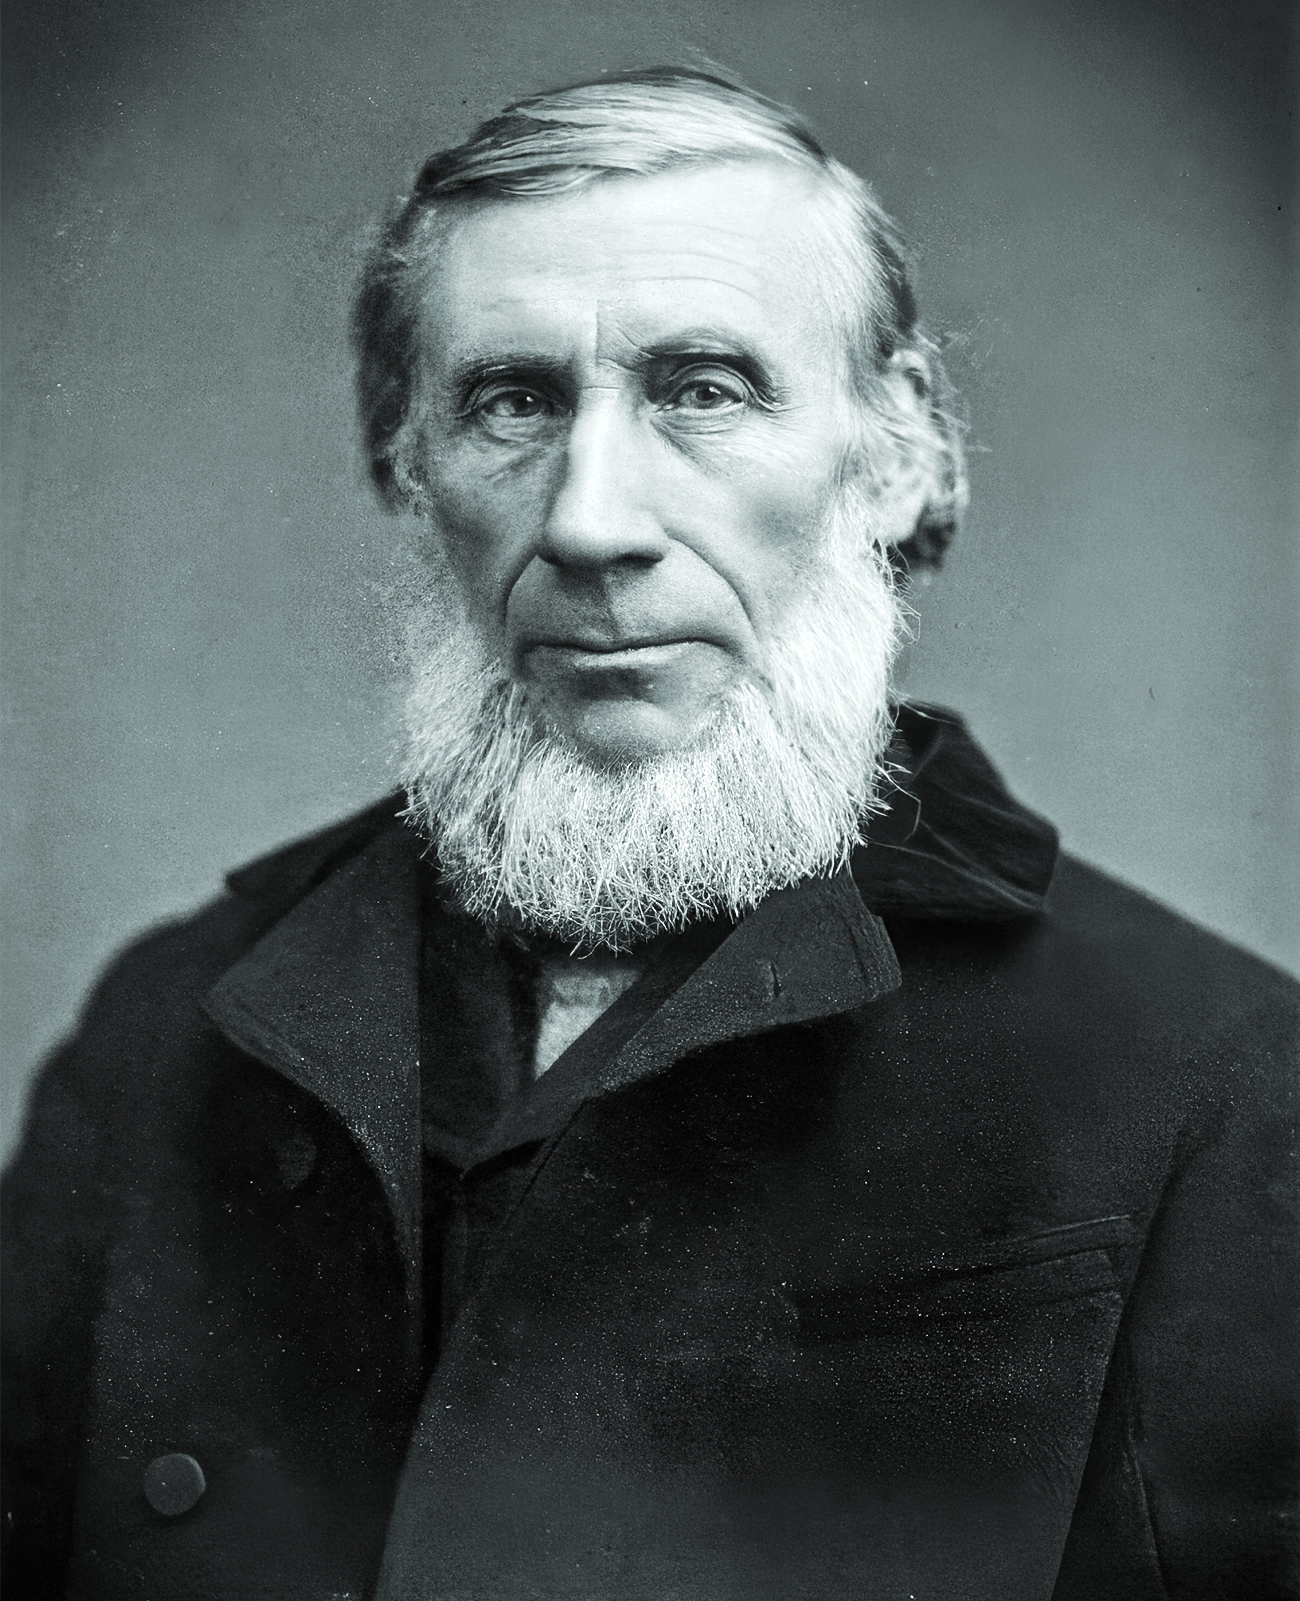
Using his radiant heat apparatus (left), the physicist John Tyndall (right) studied the effect of heat on gases.
Public Domain
“I used to be very pessimistic … but now I am more and more optimistic,” said Billur Bektaş, a plant ecologist at the Swiss Federal Institute of Technology Zurich (ETH Zurich), who is part of an international, interdisciplinary initiative to predict changes to biodiversity in ever-shifting ecosystems. “The collaborative environment of this network has been the hope for me. … I see how people really work toward this aim.”
Quanta has compiled a photographic record of climate science that captures the incalculable labor, dedication and ingenuity needed to acquire and utilize data on Earth’s climate. The effort to build climate science, spanning scientific disciplines and national borders, must surely be the most significant scientific collaboration in human history.
Climbing Into the Canopy
Deep in the remote Amazon rainforest, three lofty towers jut out of the canopy. Collectively known as the Amazon Tall Tower Observatory, they hold devices that take continuous measurements of atmospheric aerosols and greenhouse gases to help scientists understand energy and water cycles in the Amazon and beyond.
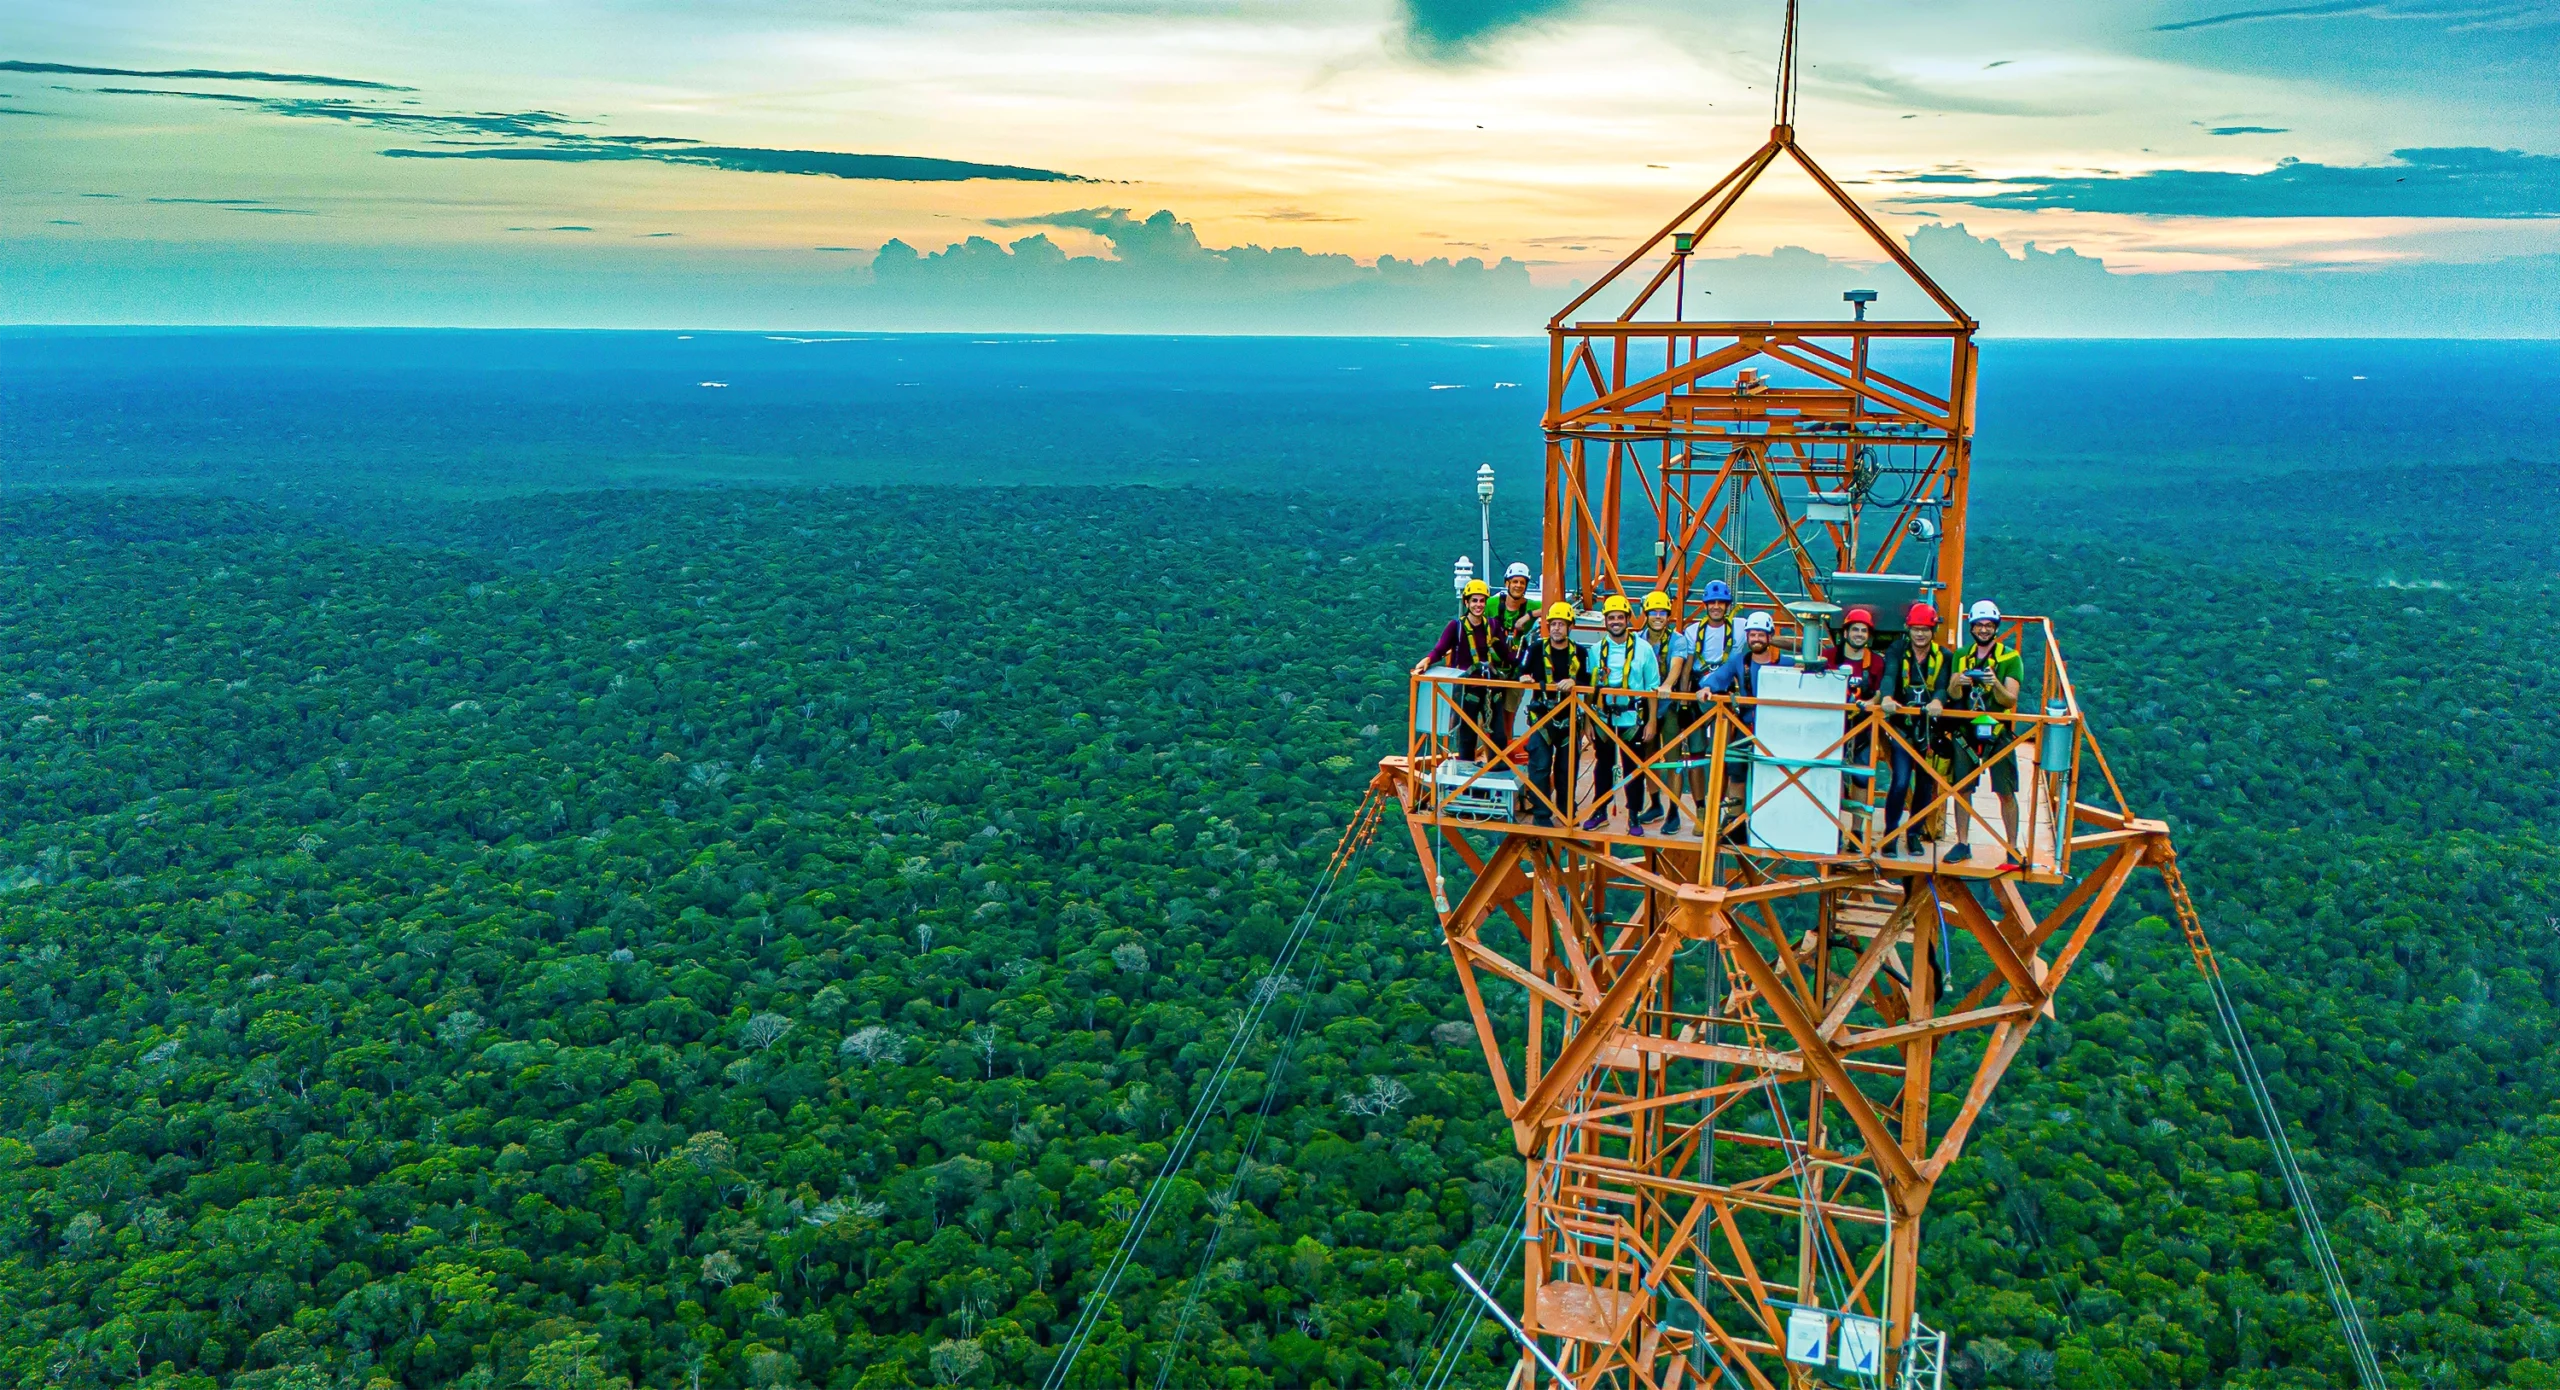
Researchers on top of the Amazon Tall Tower Observatory look out over the rainforest.
Getting to the observatory is no easy feat; it takes half a day’s travel from Manaus, Brazil, across rivers and roads built for this purpose. To reach the top of the tallest tower, 1,000 feet in the air, scientists climb more than 1,500 steps. About a third of the way up, there’s a moment where you feel like you lose contact with the surface below, said Jürgen Kesselmeier, a chemist at the Max Planck Institute for Chemistry and one of the scientists who set up the observatory. At that moment, he said, he feels “not fear, but respect.”
Drilling for Ancient Ice
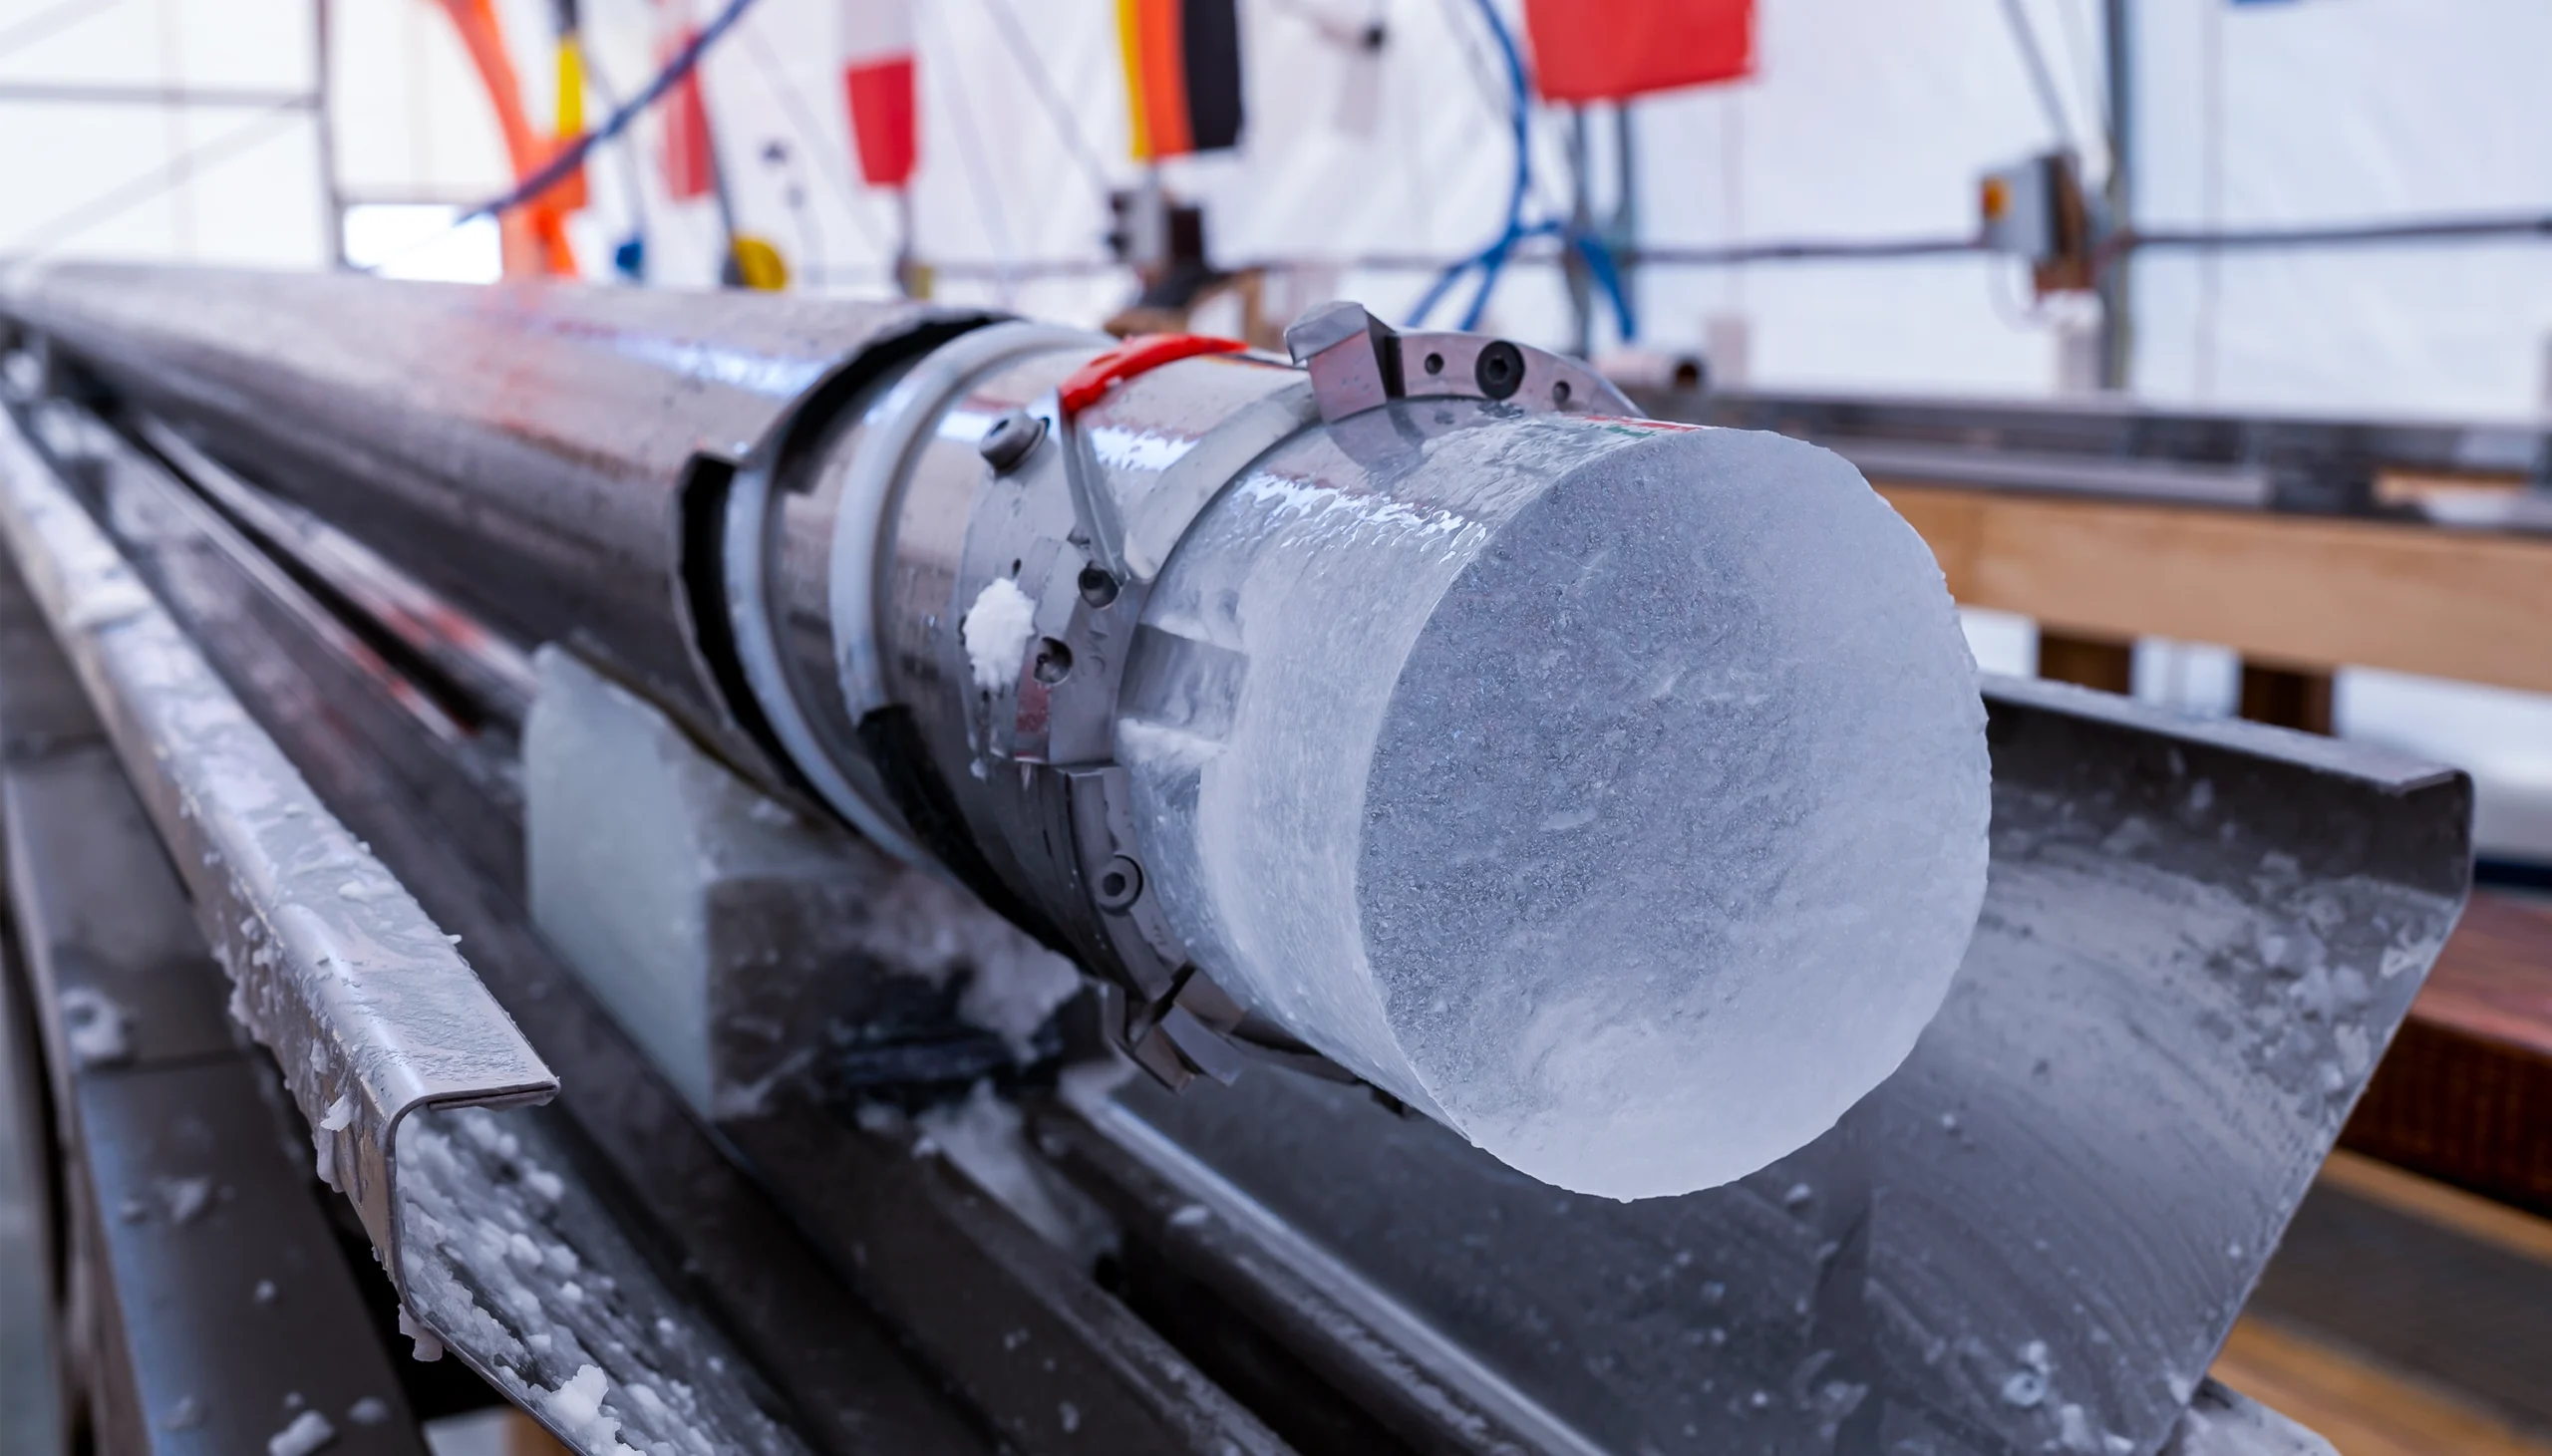
Buried deep in glaciers and ice sheets lies information about our planet’s ancient climate. In Antarctica, snowfall accumulates in layers that compact into densely-packed snow, known as firn, and then ice. Year after year, these layers trap air bubbles as well as other materials such as volcanic ash or microscopic phytoplankton. Scientists can analyze these ancient samples to infer ocean temperature, sea ice cover or levels of atmospheric gases at different moments across thousands of years.
Or occasionally millions of years. In early 2025, researchers with the Beyond EPICA project in Antarctica extracted a 1.2-million-year-old ice core, the oldest continuous record to date. About a million years ago, during the mid-Pleistocene transition, Earth’s climate changed suddenly. “If we can understand how those kind of rapid changes happened in the past, when it was occurring for natural reasons, we can use that to improve our models predicting what’s going to happen soon here with our human-induced climate change,” said James Veale, an ice core drilling engineer with the British Antarctic Survey.
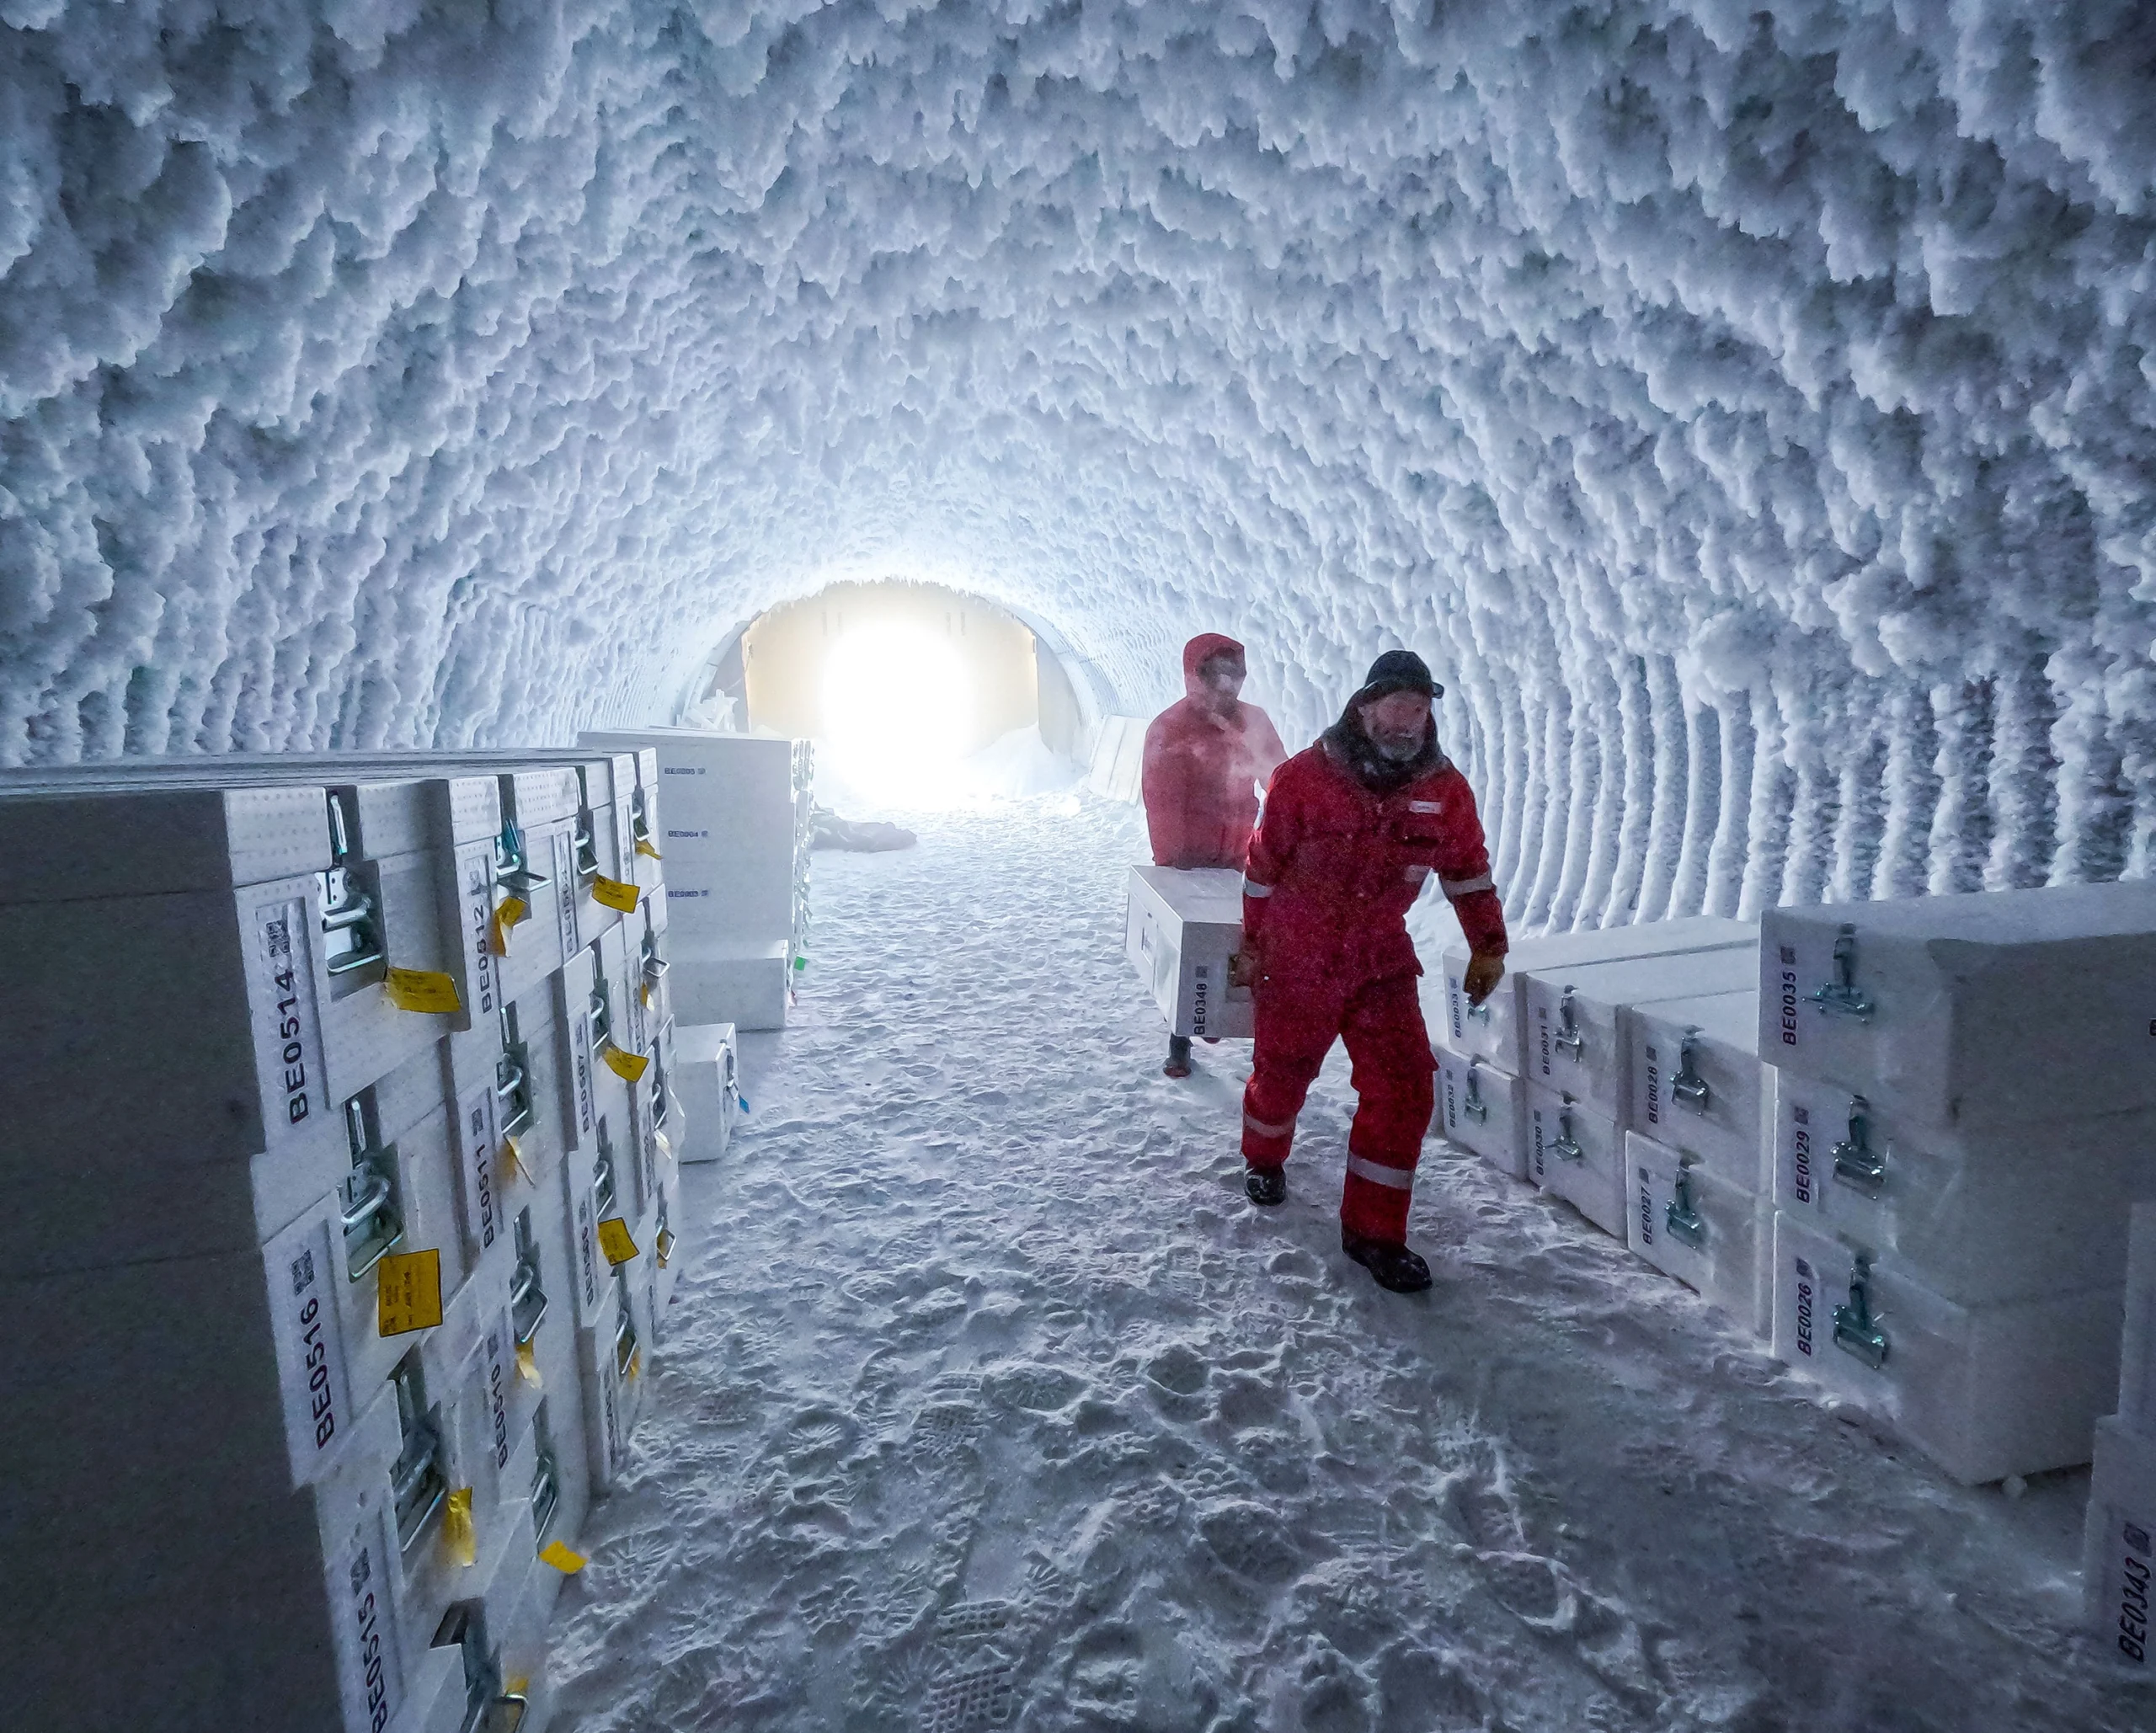
Scientists temporarily store ice cores in a frozen cave.
The drilling site Concordia station in East Antarctica has ice dating back over 800,000 years.
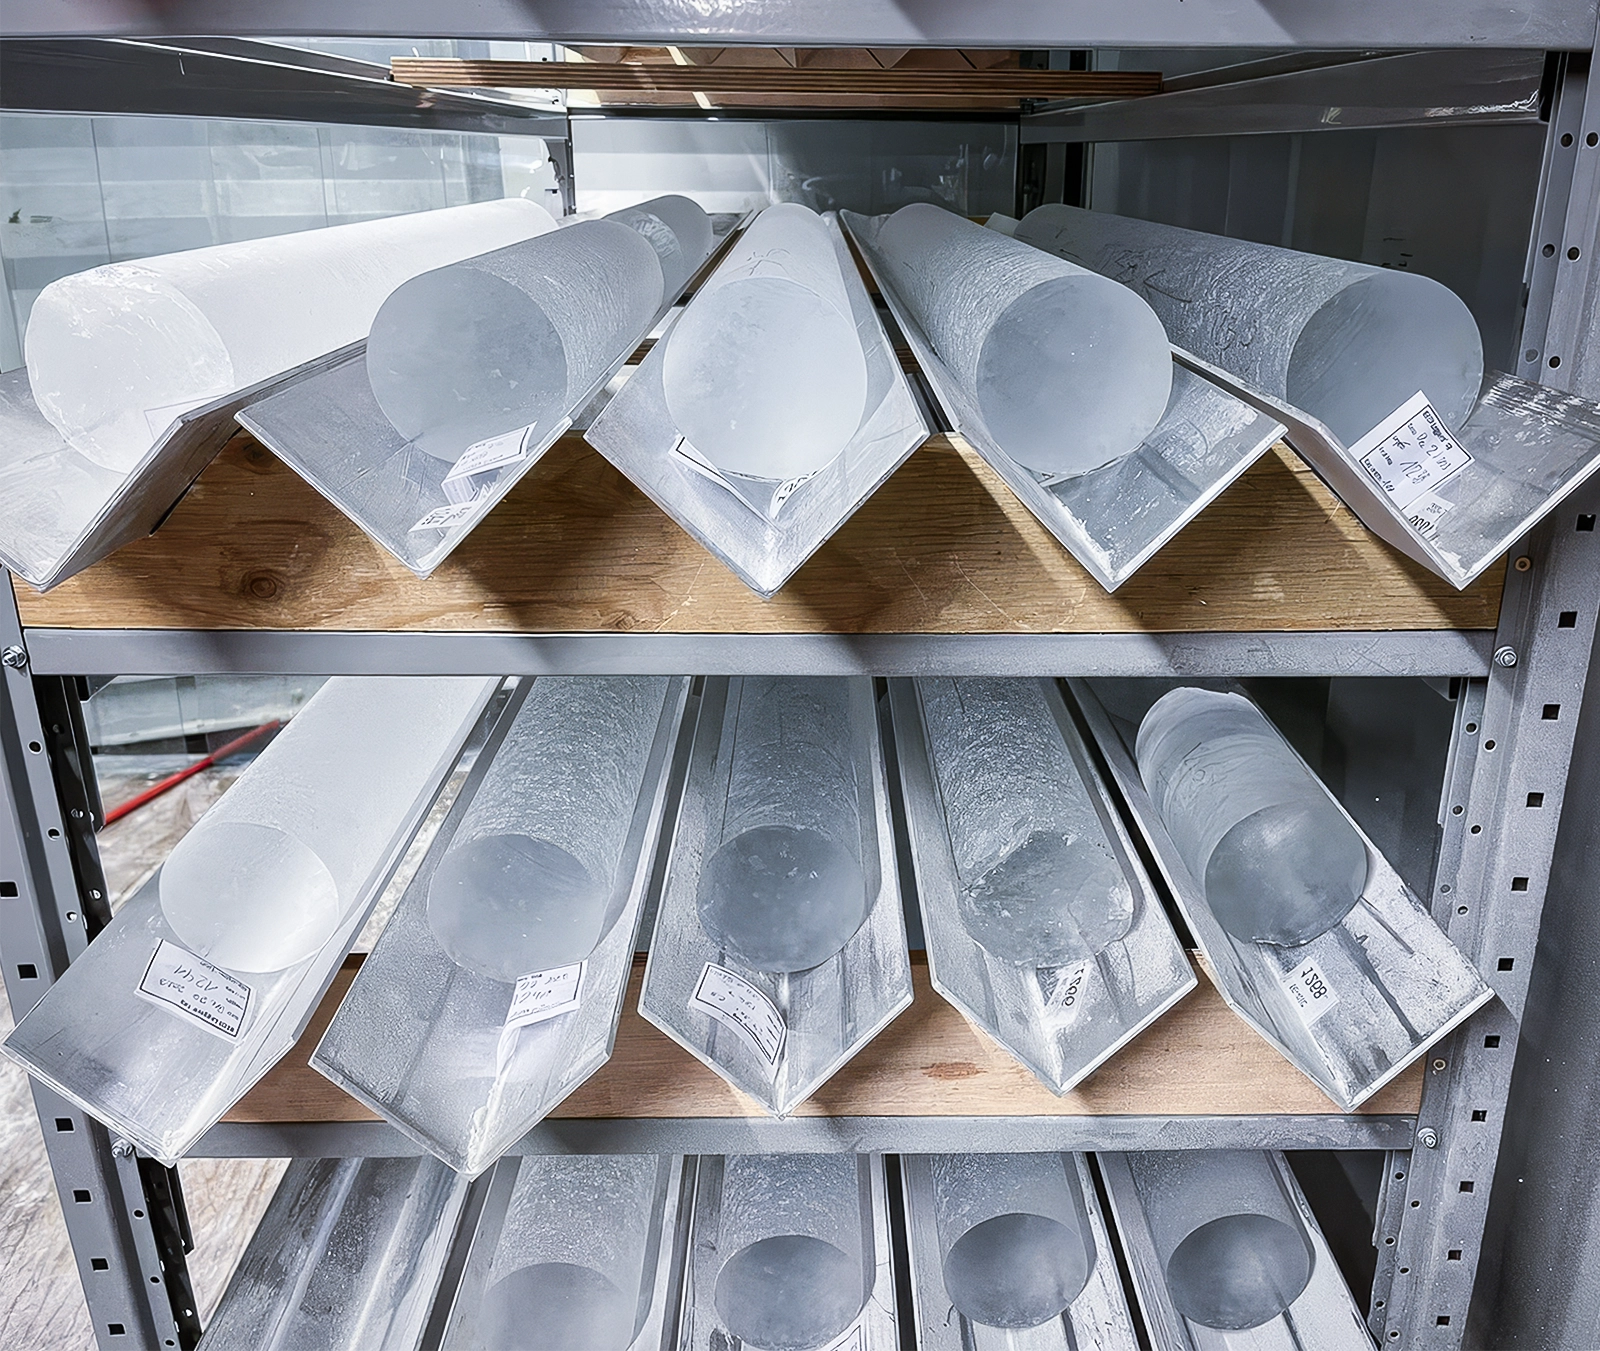
Ice cores contain trapped air bubbles that reveal information about ancient climates.
Scientists extracted a 1.2-million-year-old ice core, the oldest continuous record to date, from Little Dome C in Antarctica.
Drilling in Antarctica is both thrilling and difficult. “The rest of your life just goes on hold. … If something happens at home, there’s nothing you can do to help,” Veale said. “I hesitate to say adventure, because it makes us sound like we’re like the polar explorers of the olden days. It’s not like that anymore. We might be sleeping in tents and it might be very cold, but we have the internet. And when you’re on a project like Beyond EPICA with a bunch of French and Italians around, the food’s actually quite good.”
Conceiving of Clouds
In 2024, a research vessel traveled from the Cape Verde islands off the west coast of Africa, across the tropical Atlantic to Barbados to better understand clouds. Daniel Klocke, a meteorologist at the Max Planck Institute for Meteorology in Germany, and his team with the international Orcestra campaign spent two months collecting data, including surface wind speeds, sea surface temperature and precipitation levels, to unpack how air, seawater and waves work together to transfer heat in a process known as convection, which can generate clouds.
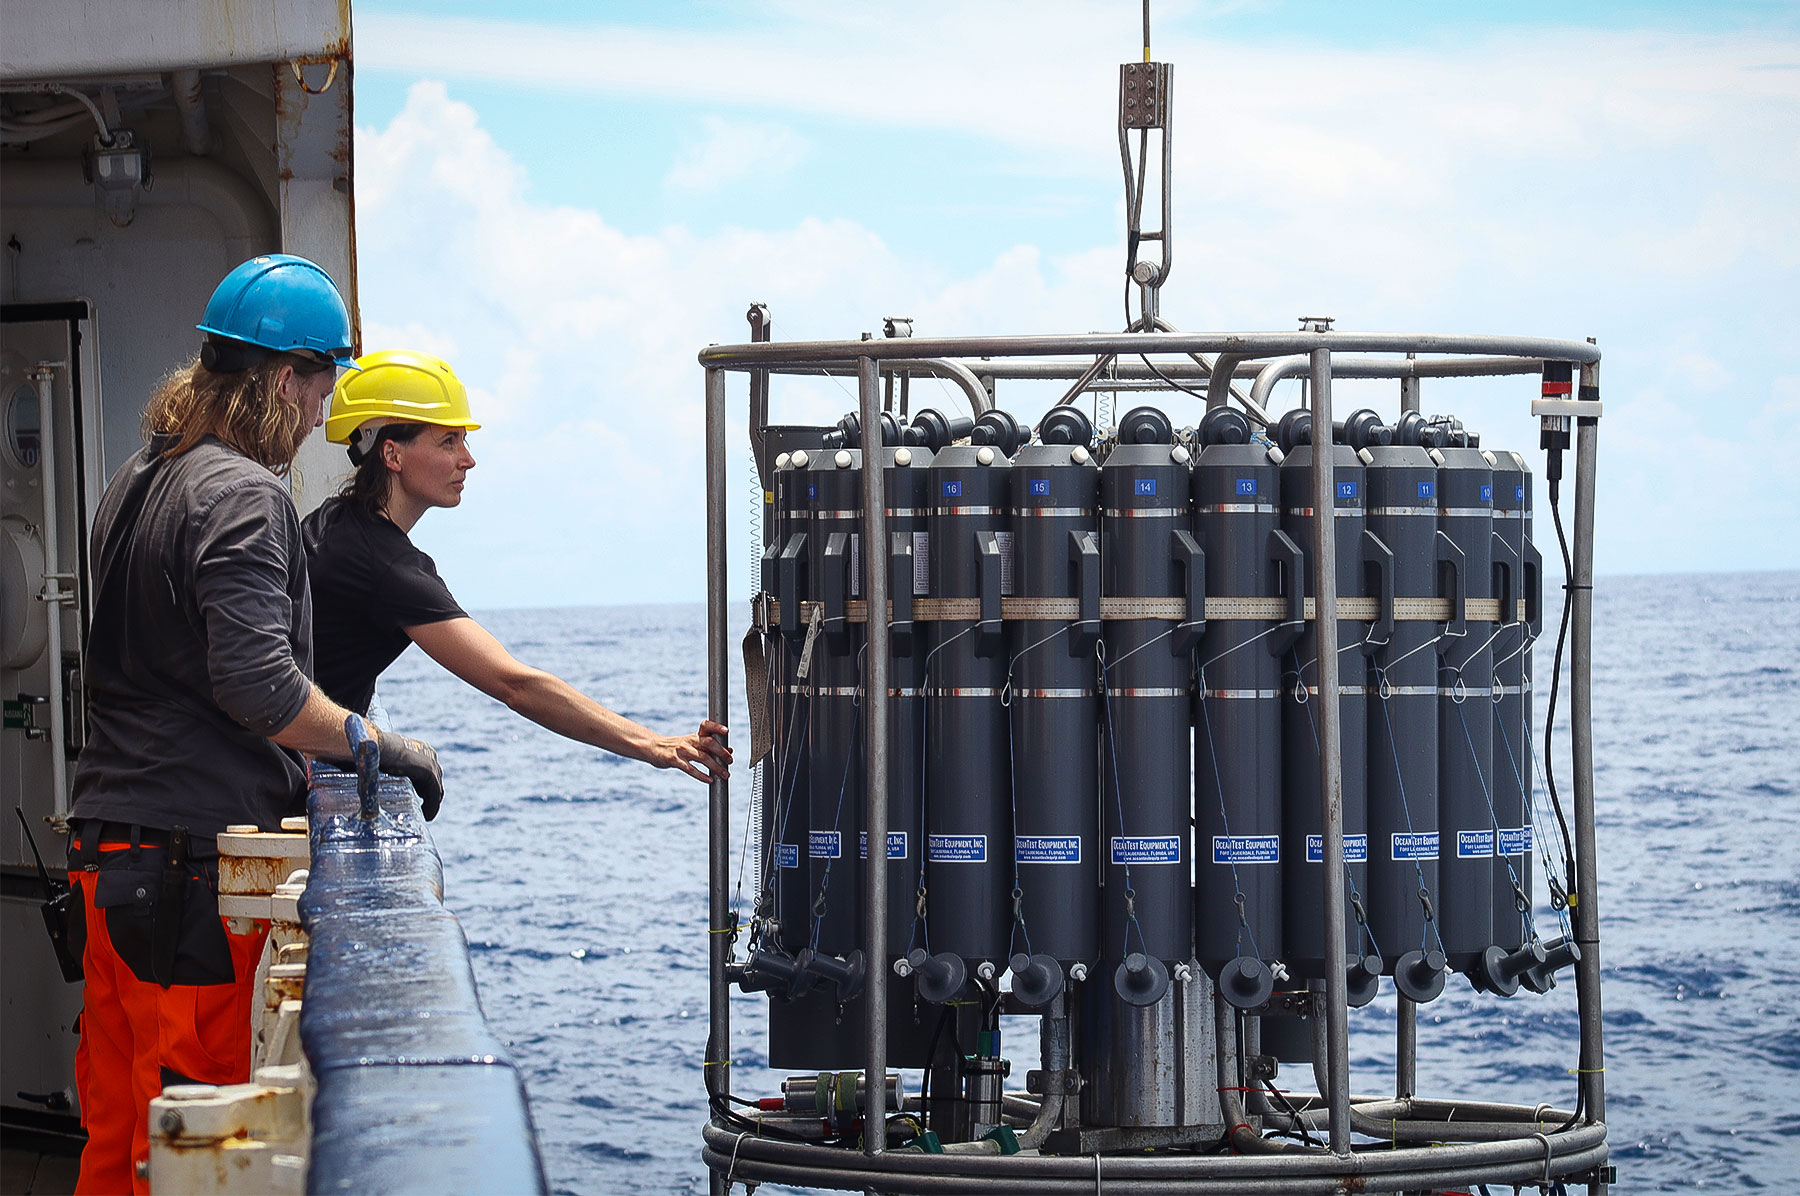
Researchers lower a CTD, or “conductivity, temperature and depth” instrument, to collect water samples.
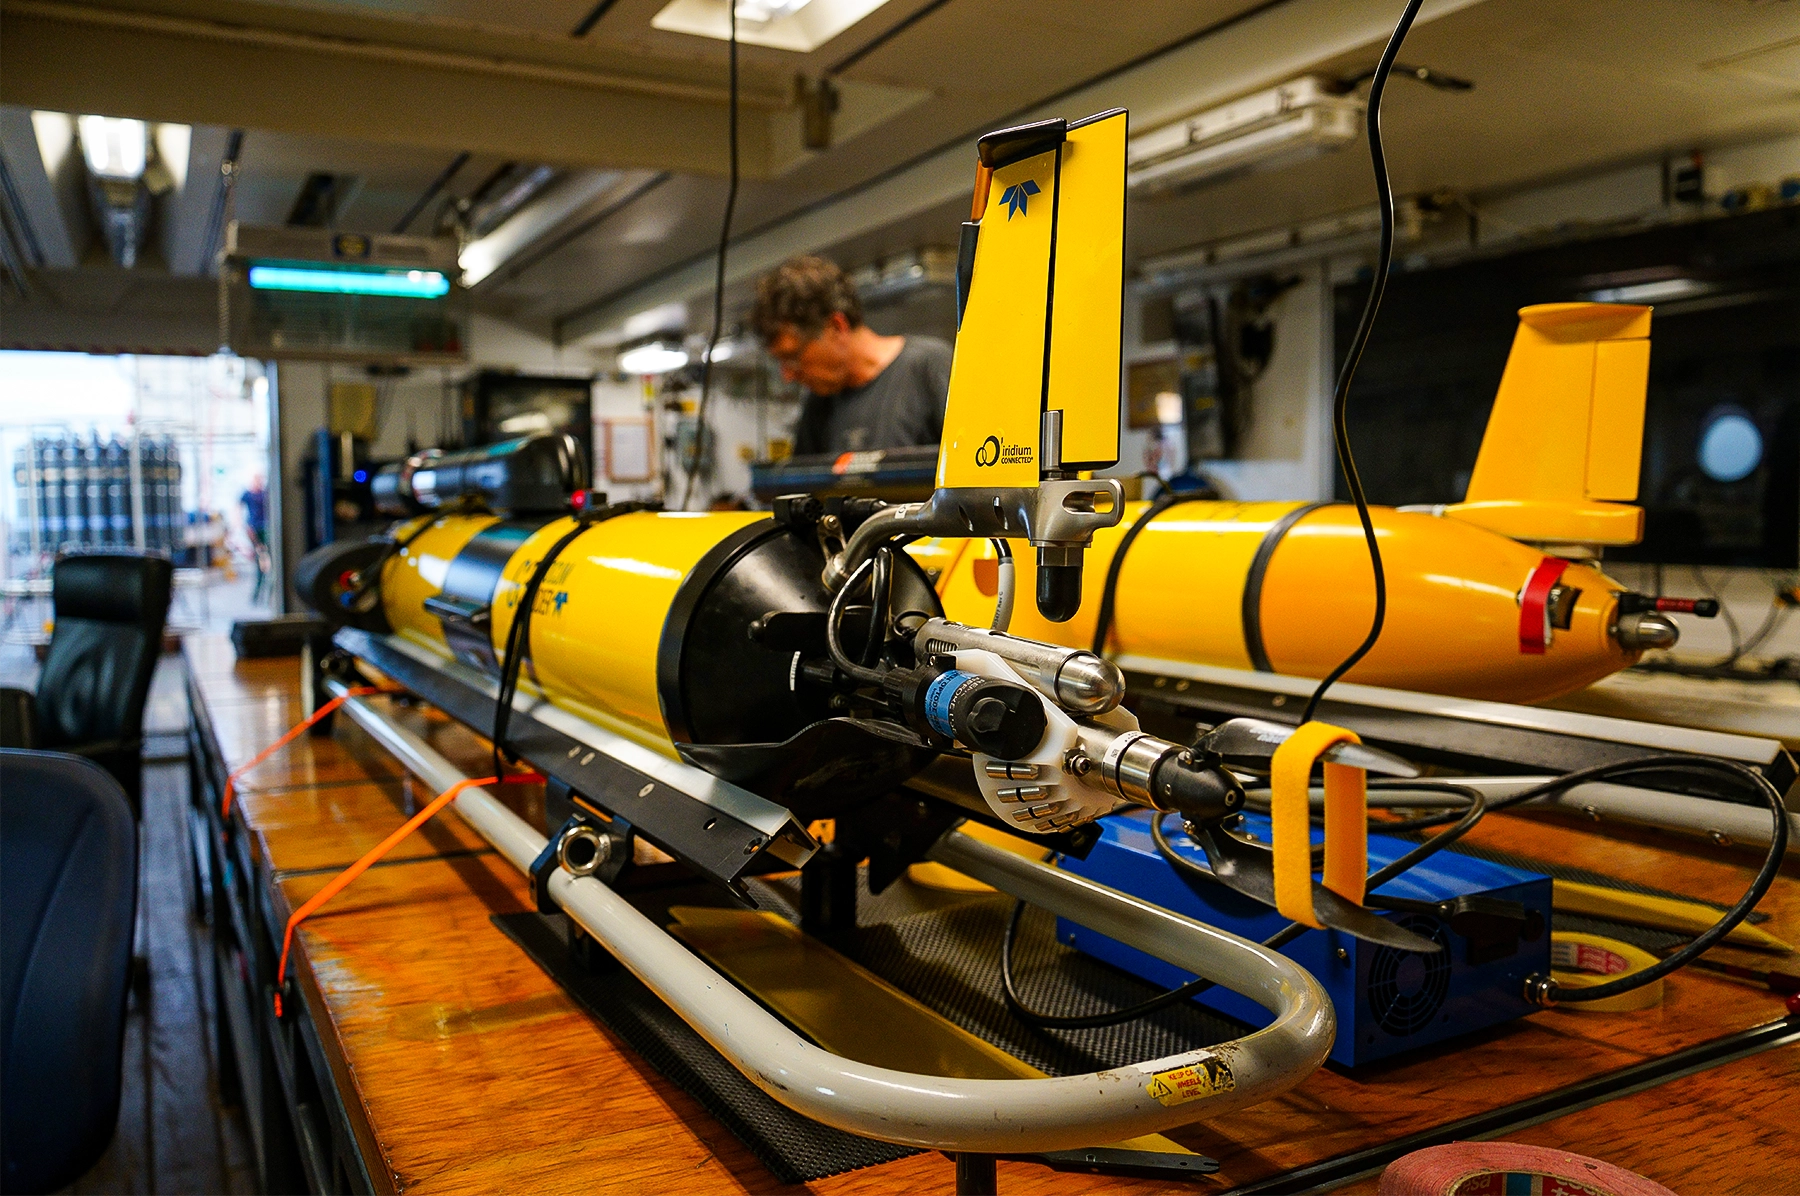
Underwater gliders sample ocean conditions such as temperature and shear, which drives turbulence.
On the boat, “everyone’s focused on the same thing,” Klocke said. “You’re detached from the rest of the world. You’re working and enjoying life in the same place.” But even out in the middle of the Atlantic Ocean, they weren’t alone. Every couple of days, research planes from Germany, France and Romania flew over them. A Japanese-European satellite gazed down from above, and drones frequently zipped by. By taking measurements of clouds using these different modalities, the Orcestra researchers aim to collect data needed to refine our understanding of one of the great uncertainties in current climate models.
Constantly Catching Molecules
The Integrated Carbon Observation System, or ICOS, is a web of nearly 180 measurement stations scattered across 16 European countries. Some are remote — at sea, on mountaintops, out on the tundra — and some are near or in cities. They constantly collect data on greenhouse gases and the flow of carbon across the atmosphere, surfaces and oceans. This kind of continuous monitoring is critical for developing and maintaining climate models.
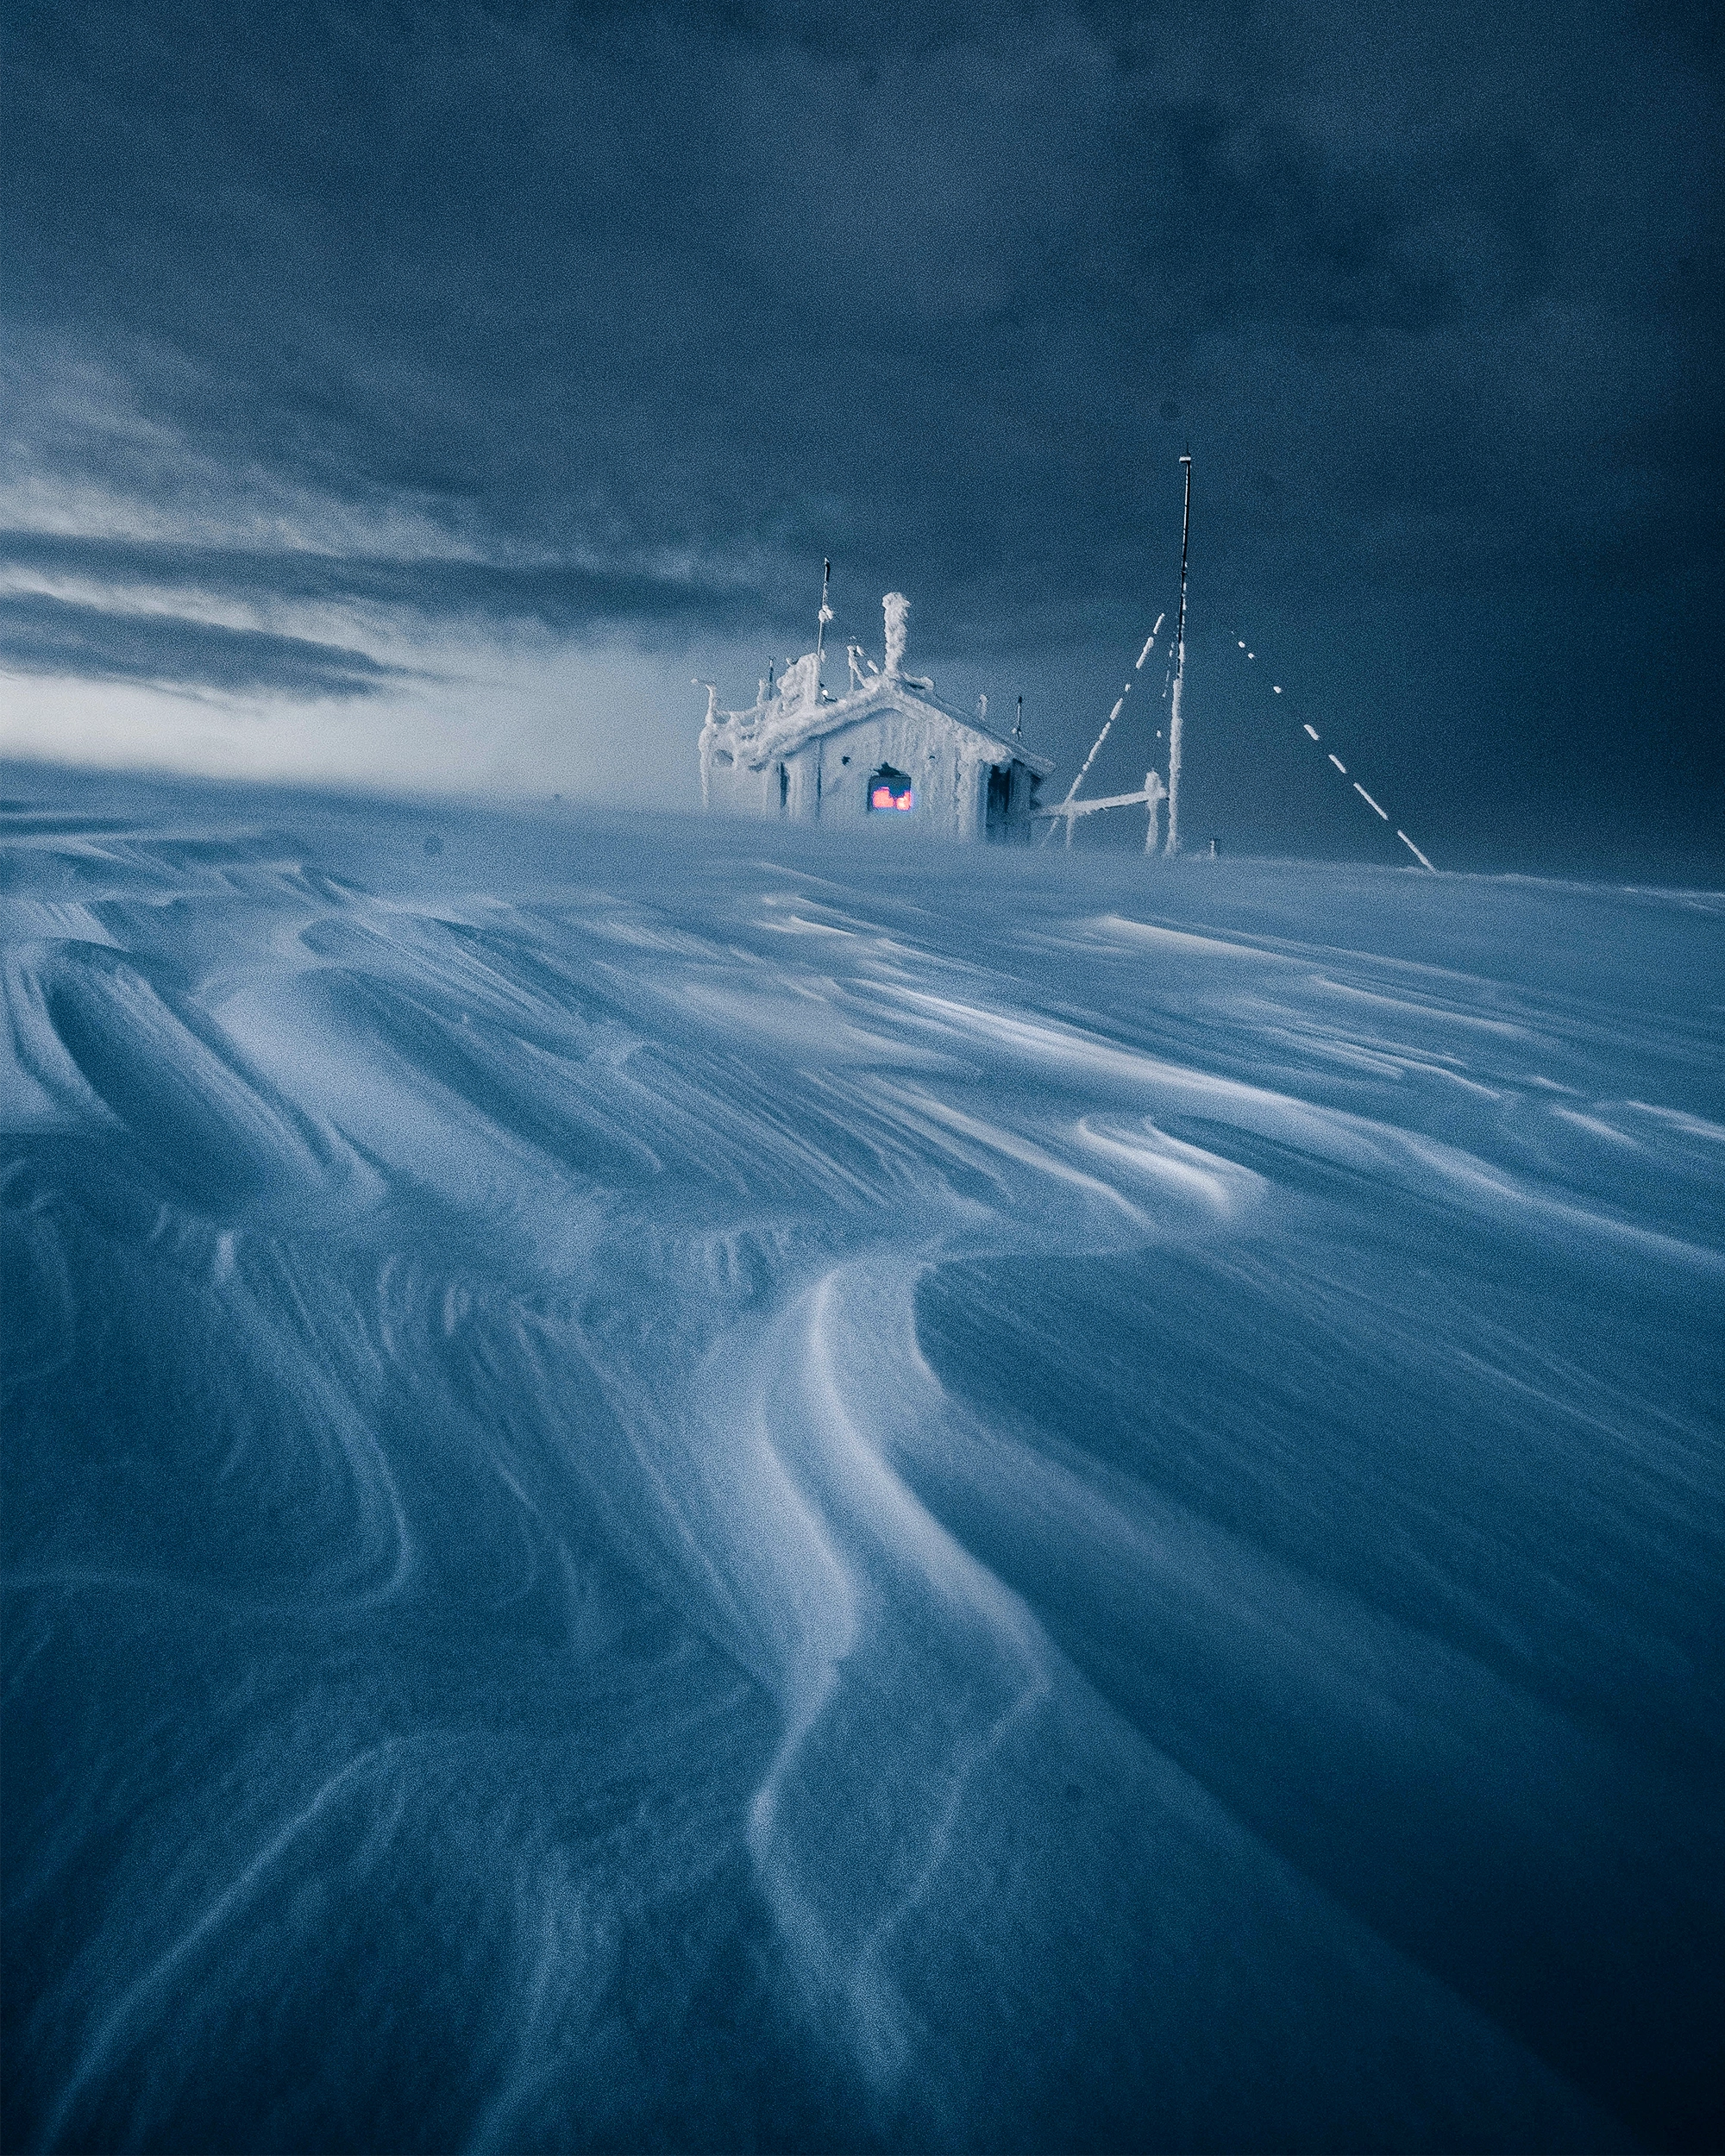
ICOS station Pallas Sammaltunturi, in the Arctic tundra of Lapland, measures air from the Norwegian Barents Sea and the North Atlantic.
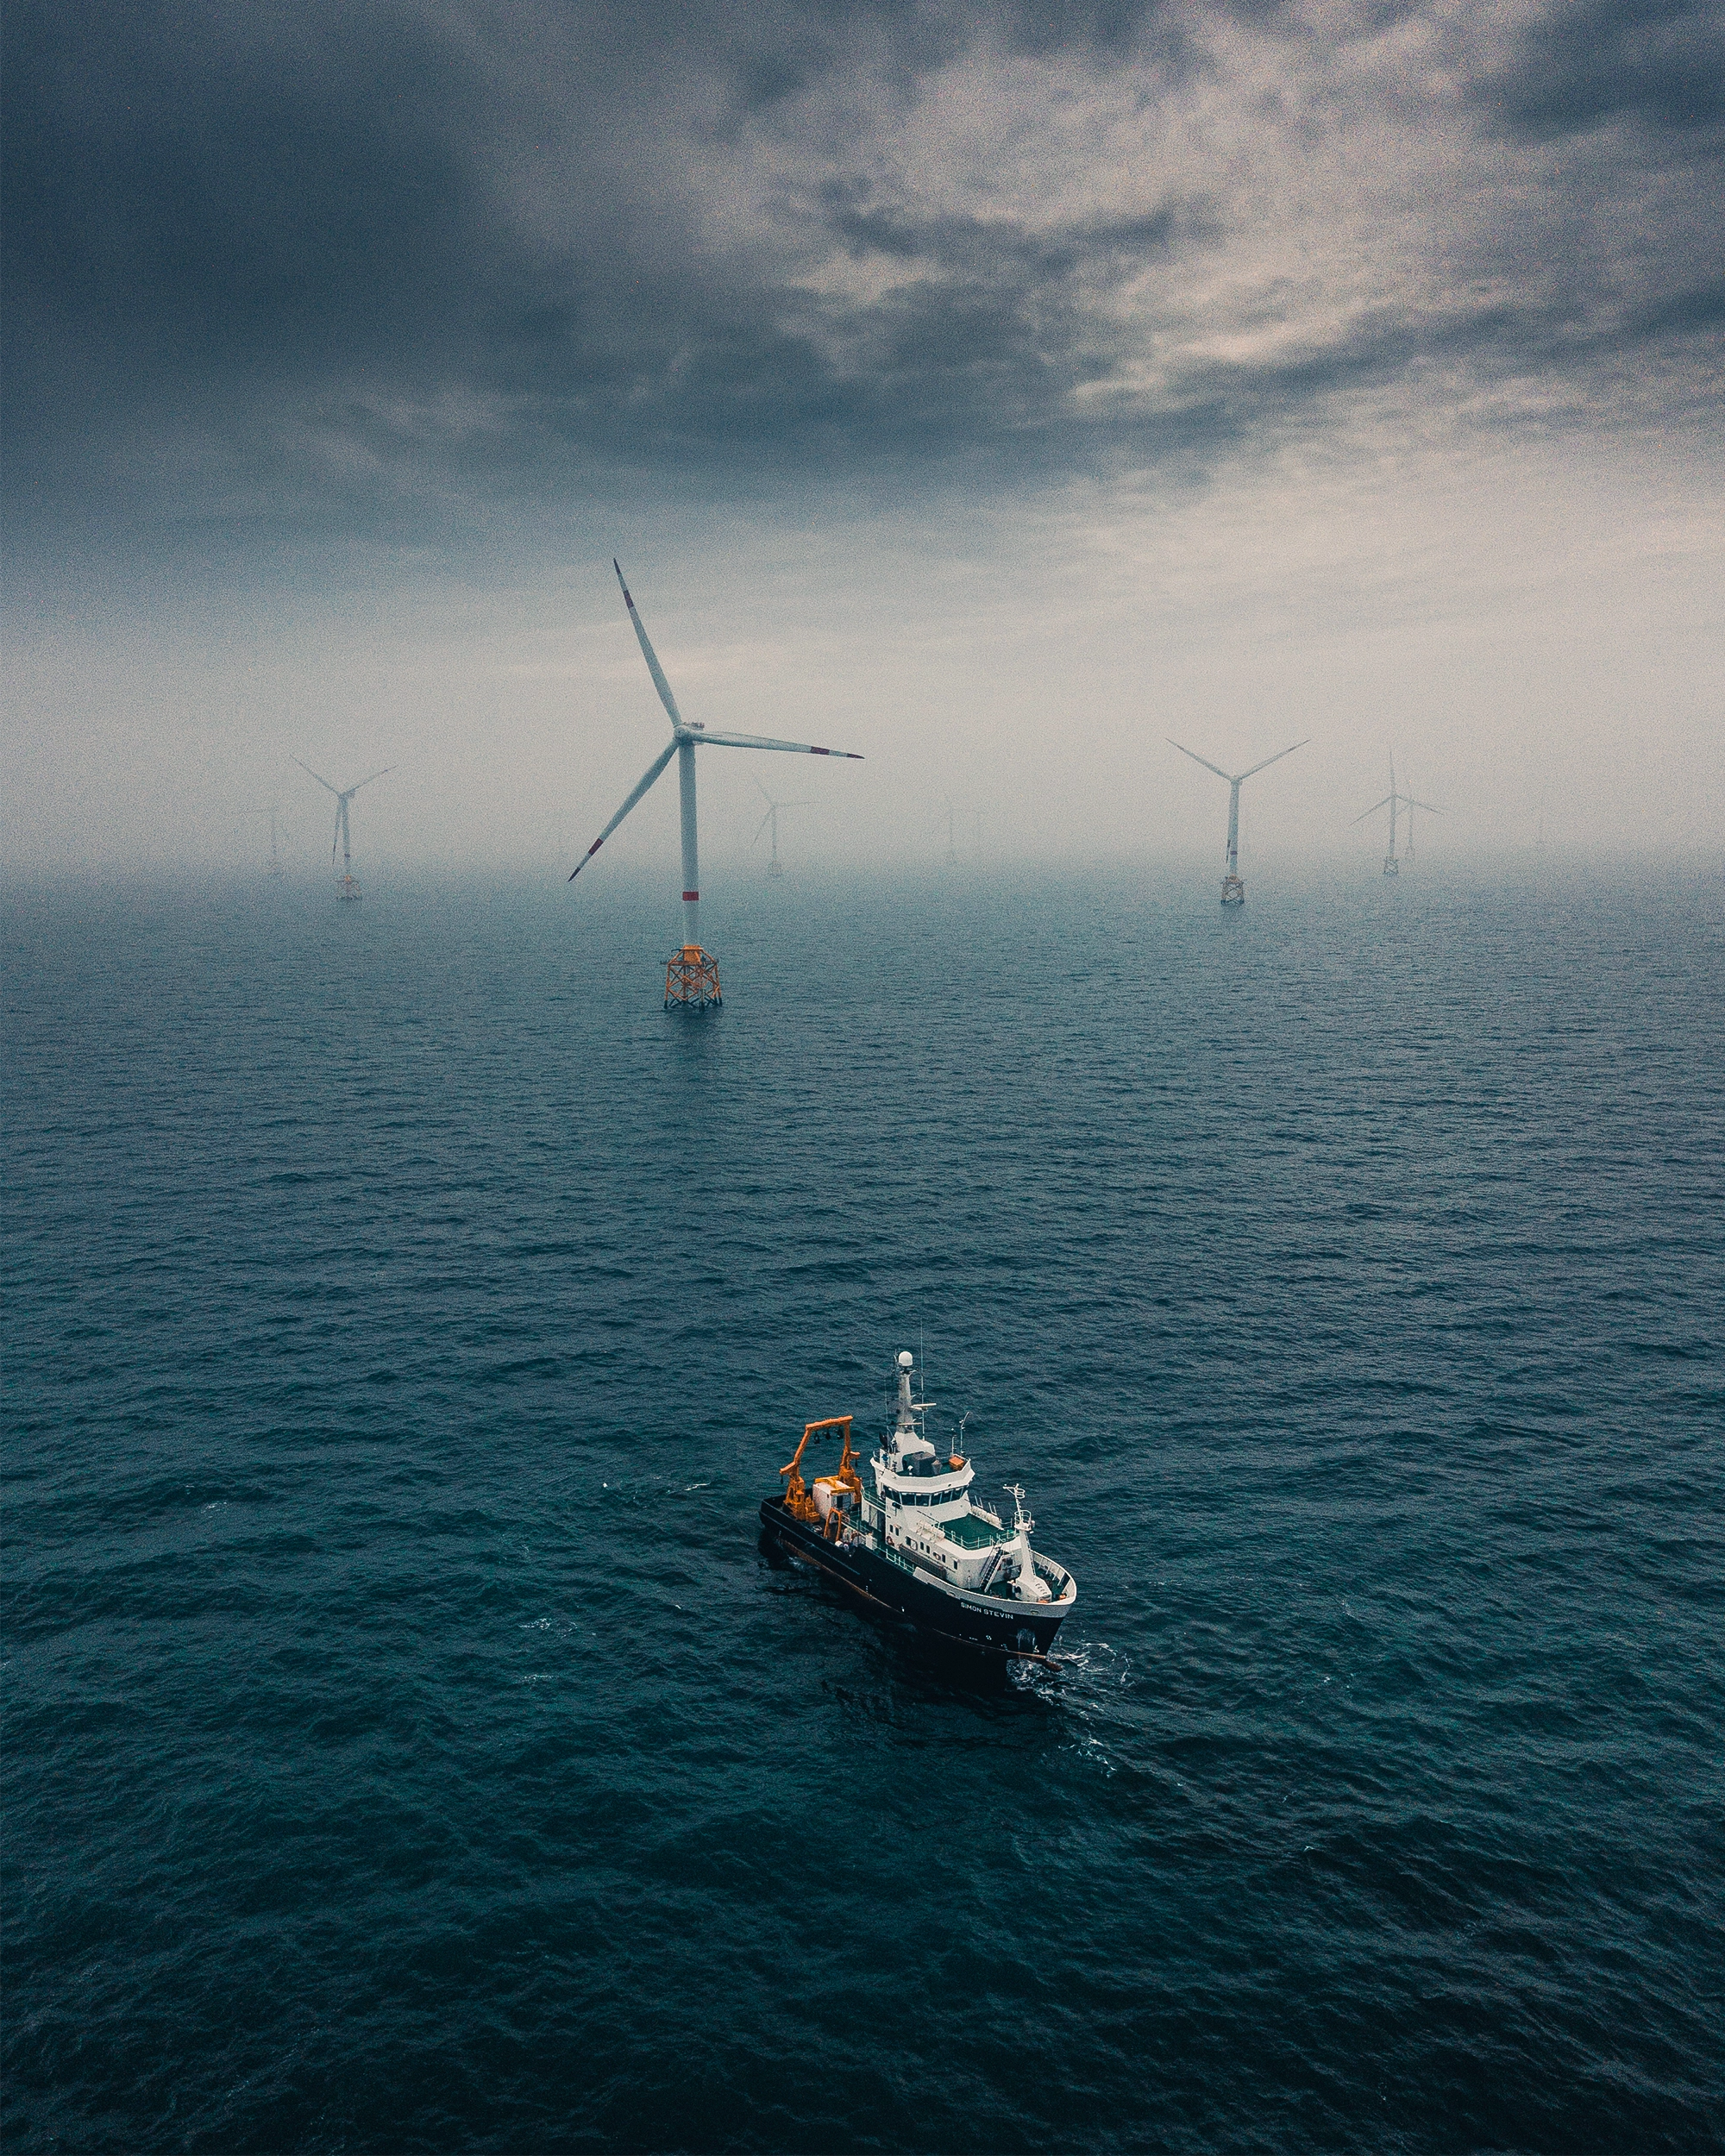
The ICOS Simon Stevin research vessel measures greenhouse gases in the North Sea.
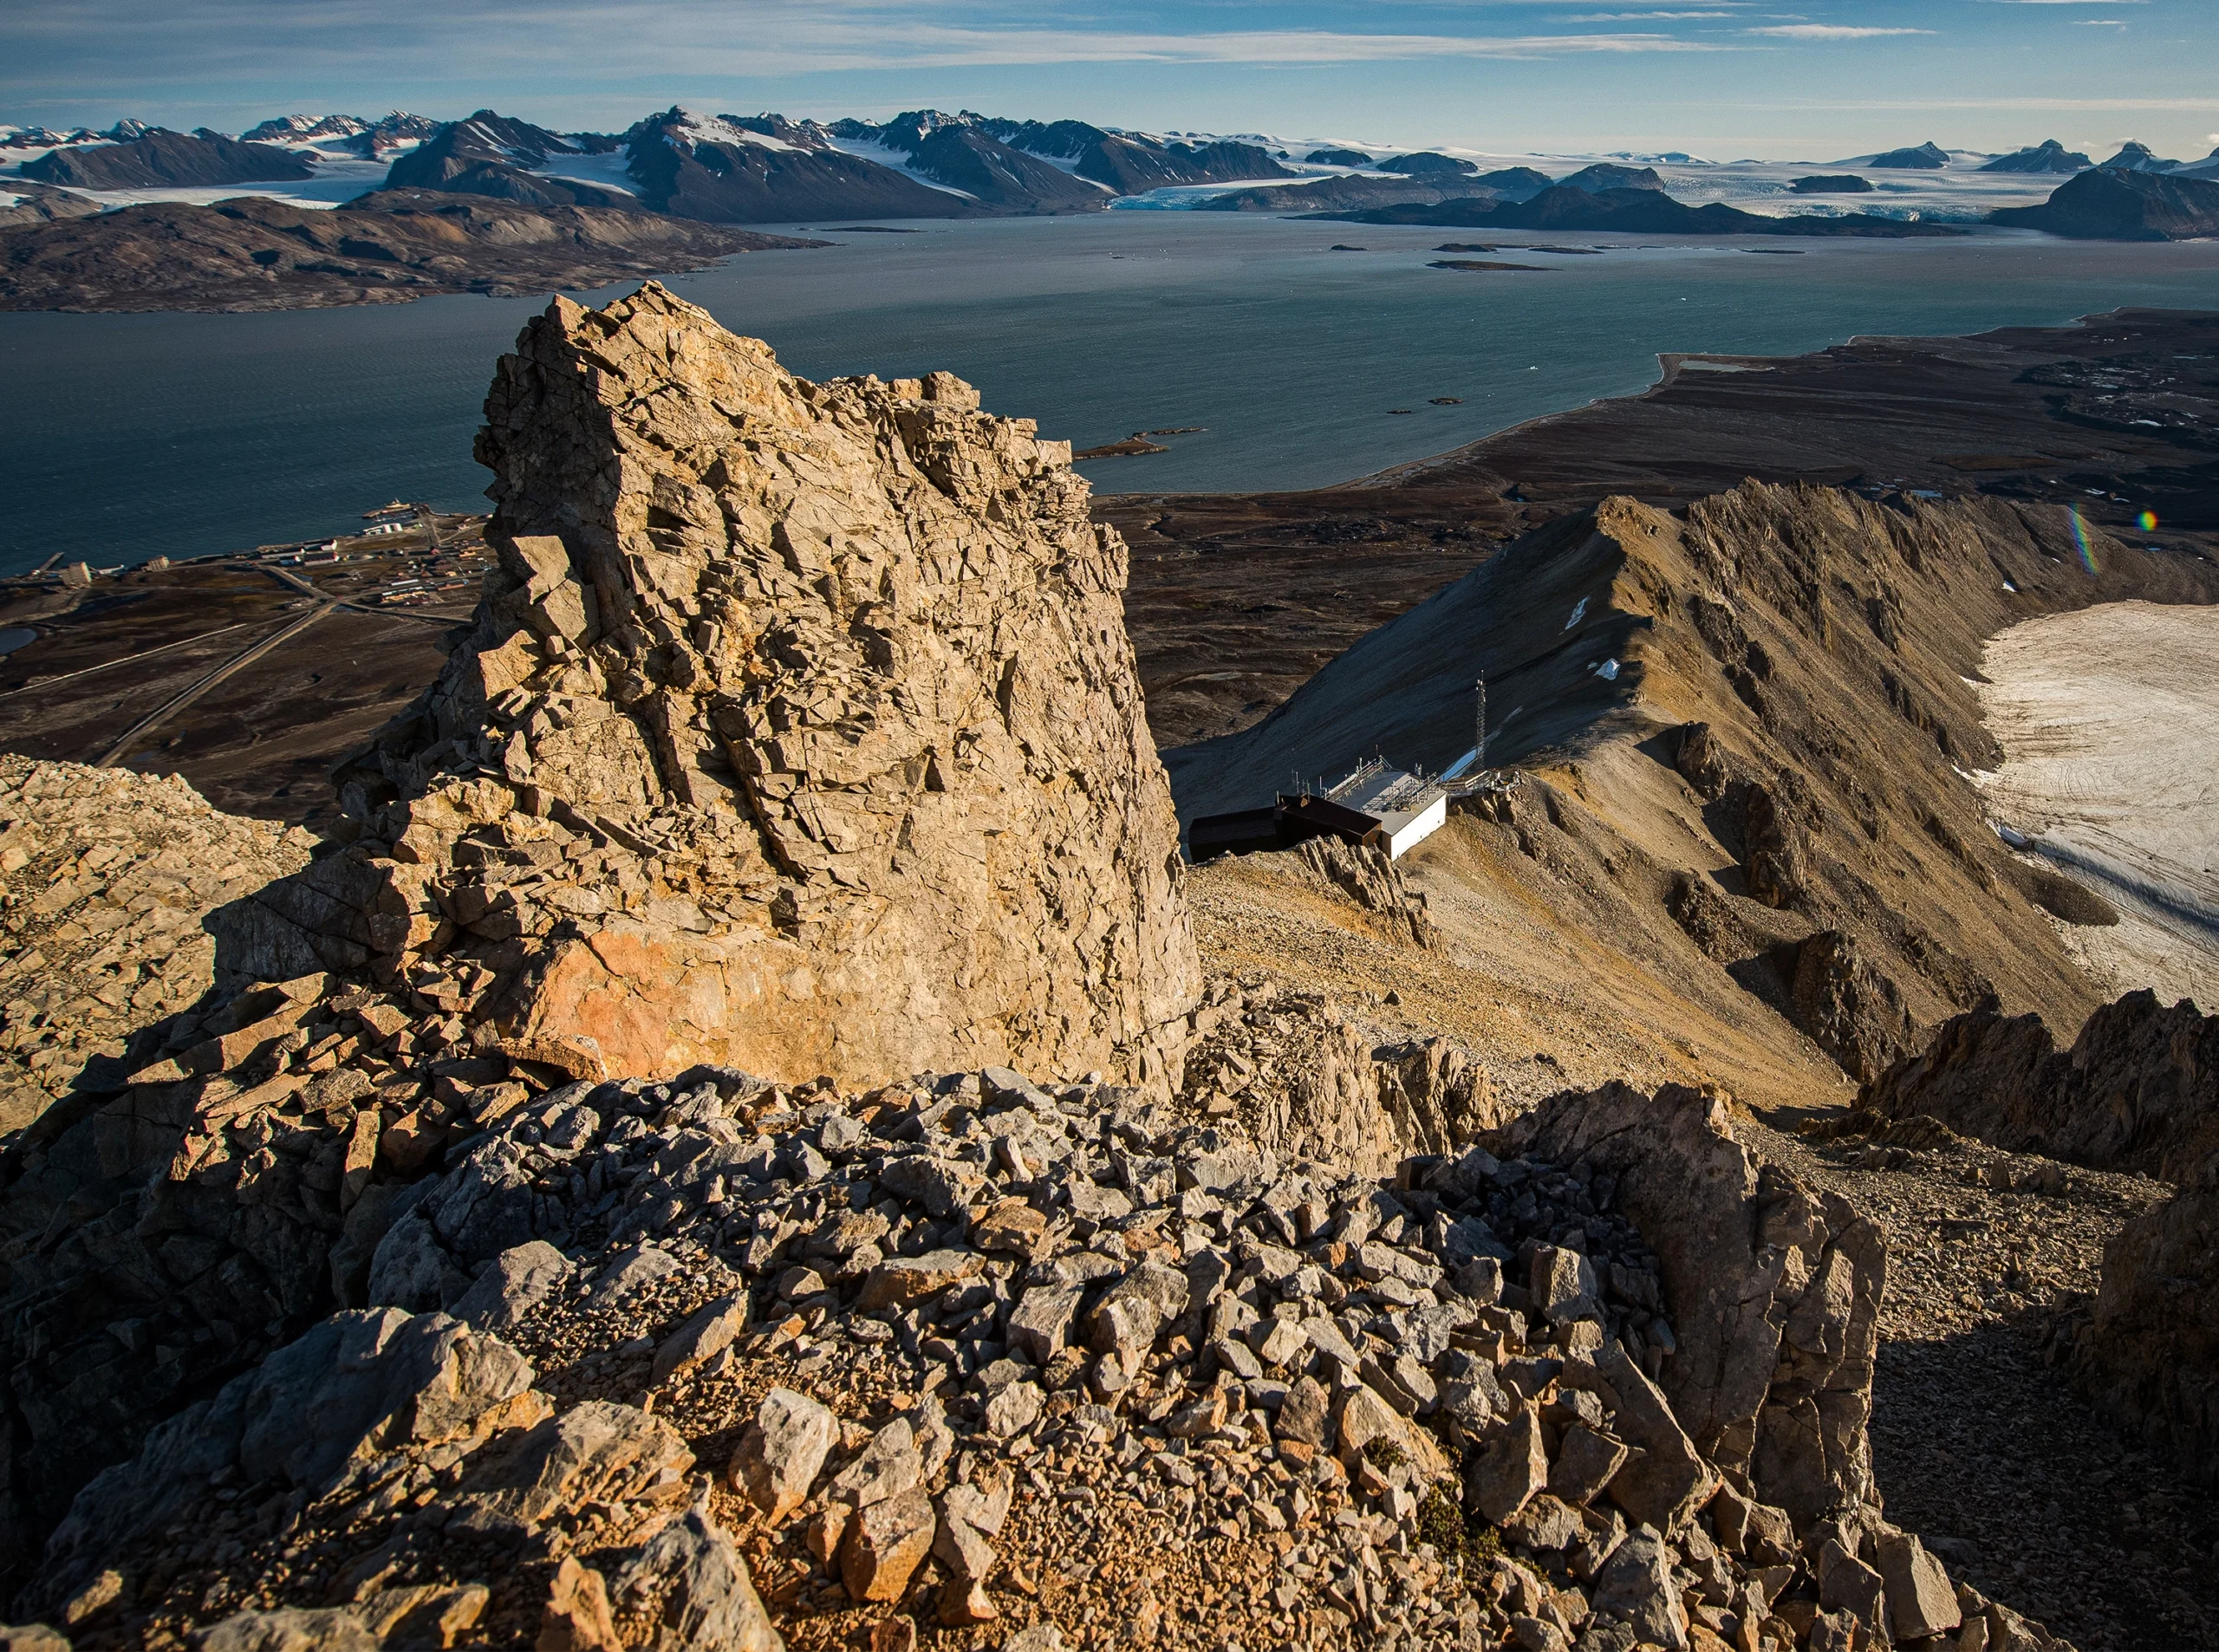
Norway’s Zeppelin Observatory measures gases 1,000 kilometers south of the North Pole.
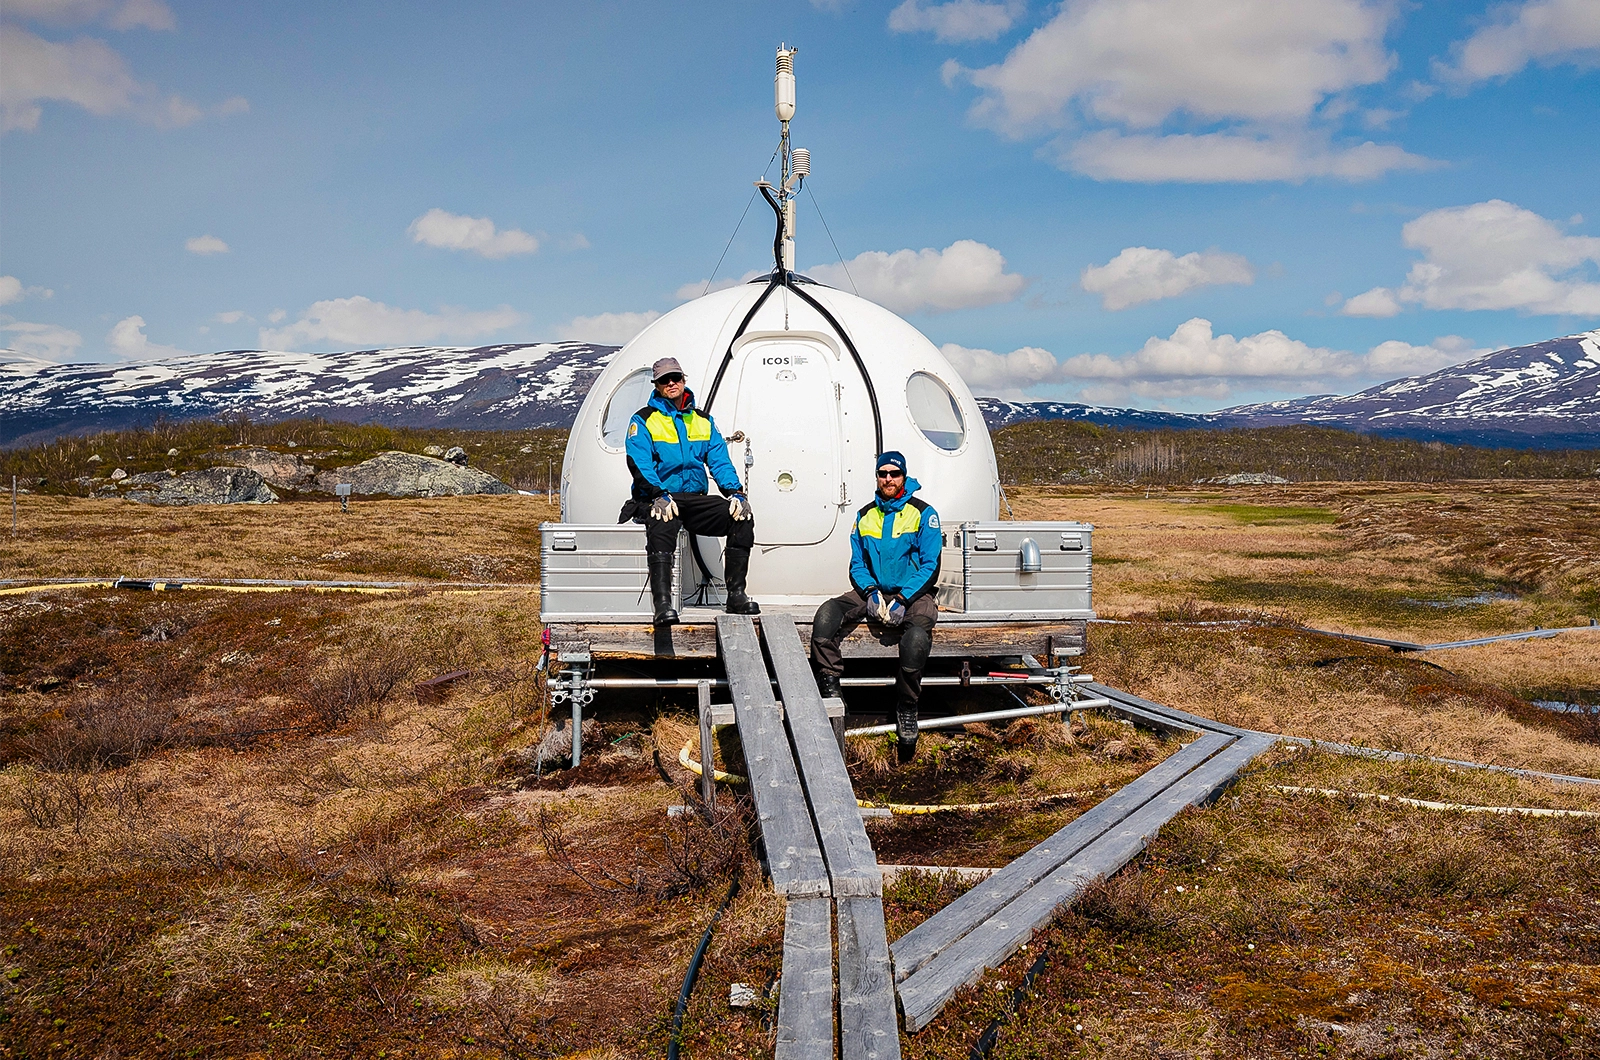
Researchers recently installed equipment to measure the Earth’s surface temperature at the Abisko-Stordalen Palsa Bog, Sweden.
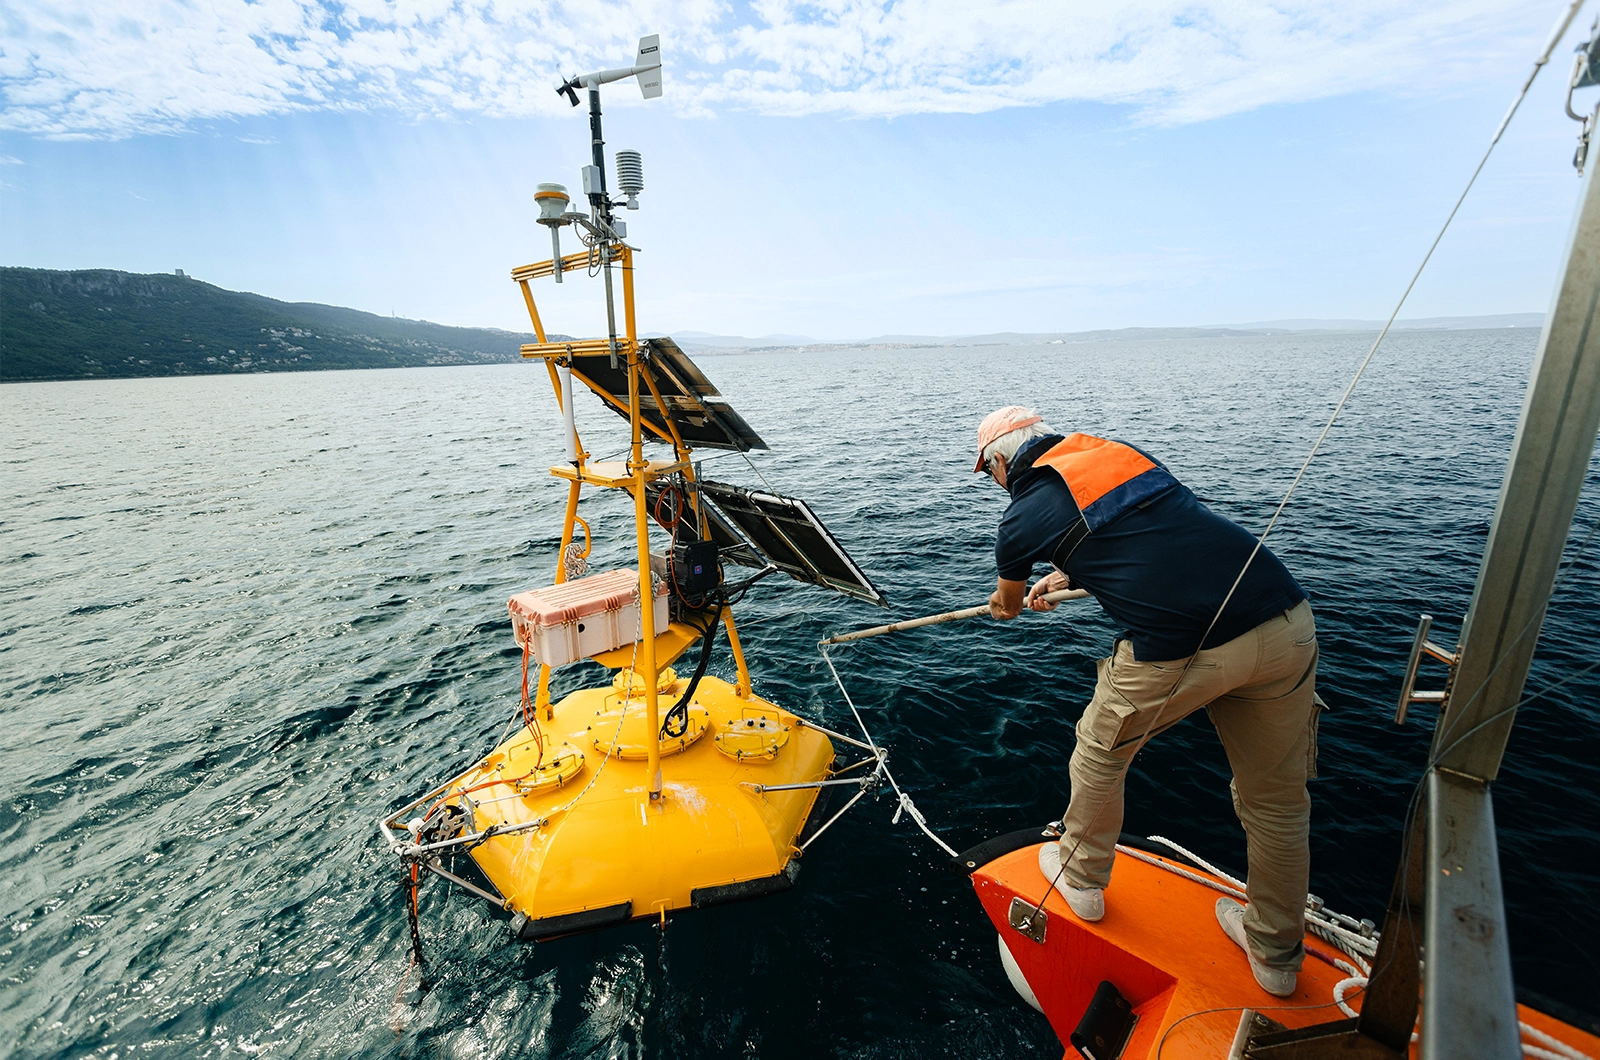
Marine chemist Michele Giani catches a buoy at the Miramare station to monitor ocean processes in the Adriatic Sea.
Moving Mountains
A helicopter lifts a huge chunk of vegetation extracted from a mountainside and flies it downslope. “We’ve been doing these crazy experiments that require us to transplant tons and tons of soils and communities,” said Bektaş, the ETH Zurich plant ecologist.
More than 20 research groups around the world have conducted more than 40 experiments in this style, where they uproot a square meter of soil with all its vegetation — what Bektaş calls a “natural laboratory” — and replant it at a lower elevation. Over many years, they’ve been tracking these natural laboratories, complete with microbes, plants and fungi, to see how they adjust to warmer conditions.
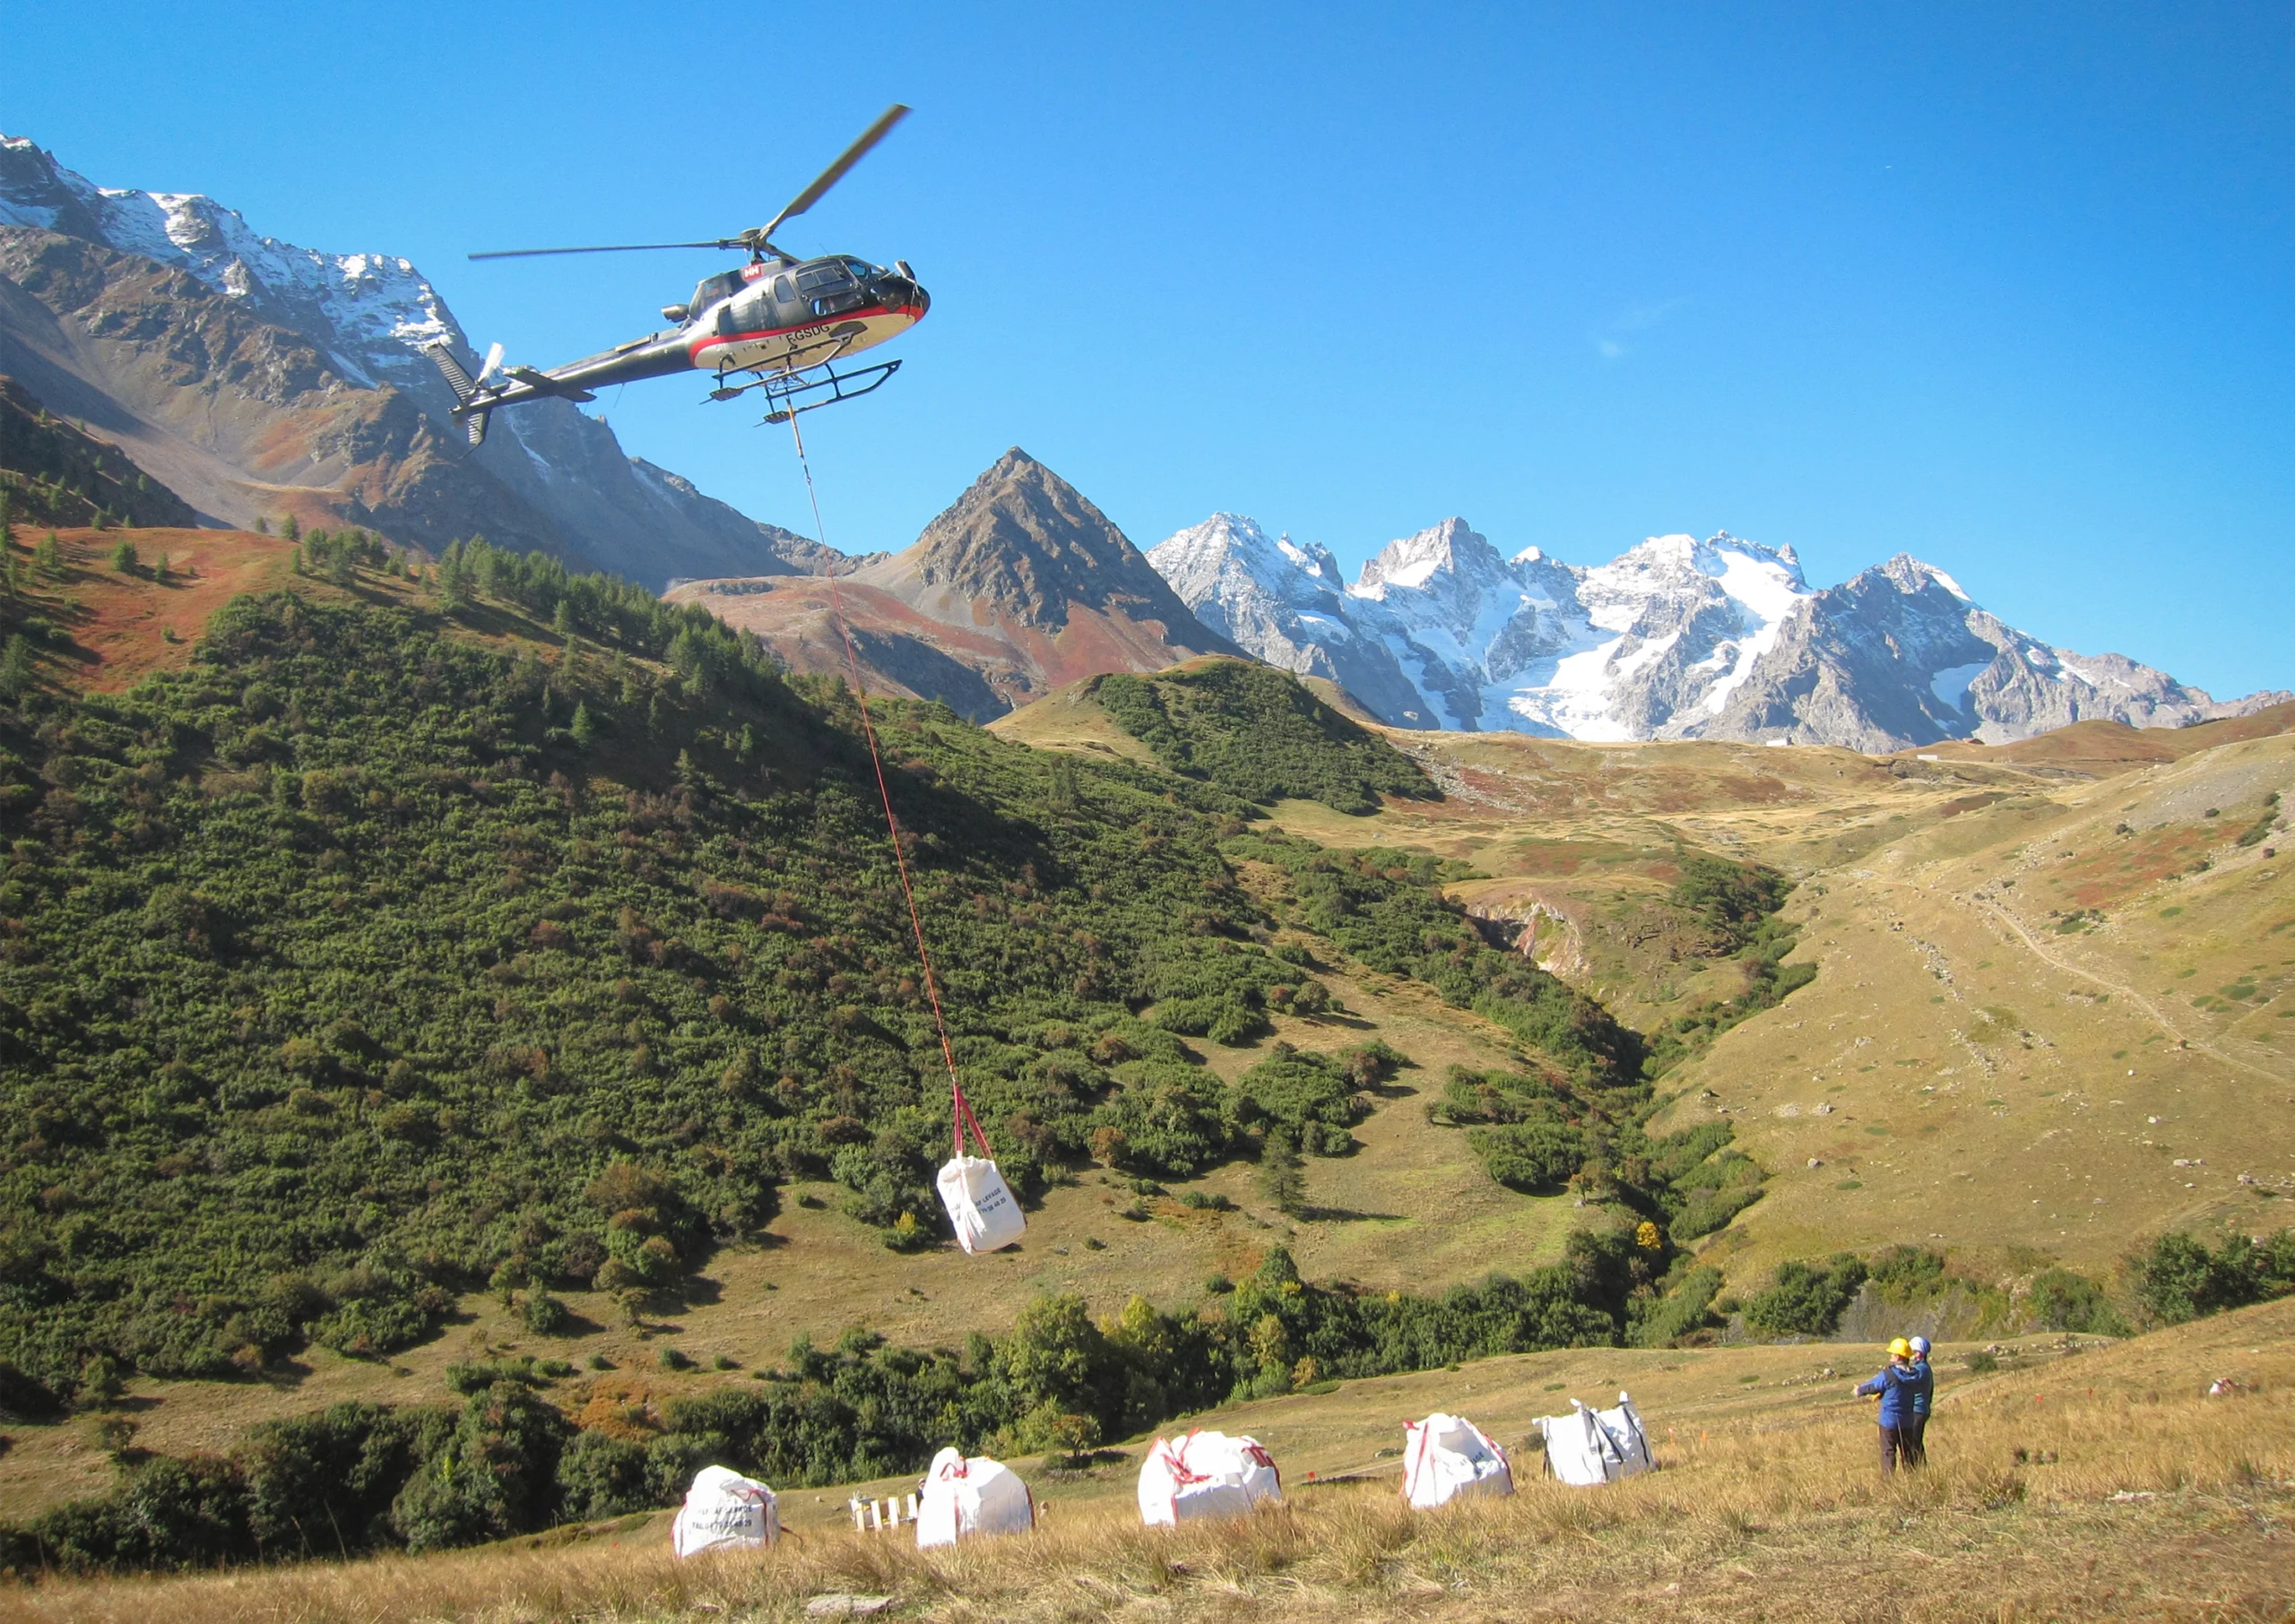
In 2016, a helicopter transported land from higher to lower altitudes in the French Alps.
The researchers are already finding that the communities respond in unexpected ways. For example, plants and fungi acclimate to the new environment at different rates, suggesting a potentially problematic asynchrony that could disrupt ecological communities as warmer temperatures creep up mountainsides.
Crunching Numbers
Scientists often simulate one part of the climate story at a time, focusing on the atmosphere, the ocean, the land, or even just a sliver of one of those areas, said Klocke of Max Planck. But such simulations can be coarse or fuzzy, which makes it hard to draw strong conclusions about extreme climate scenarios from them in isolation.
Enter supercomputers. Jupiter, based at Forschungszentrum Jülich in Germany, is one of the fastest in the world, capable of performing 1 quintillion calculations per second. This speed lets researchers simulate many interacting components of the Earth system in high resolution, while preserving the ability to zoom in on smaller units, such as an accurately modeled coastline.
The Jupiter supercomputer yields high-resolution climate simulations.
“The information content just becomes much larger, and one will be able to make more refined statements about climate change,” Klocke said. He hopes such models will help us understand the local impacts of climate change, which are what “really matter to people,” he said. “Nobody has a sensor for global mean temperature. … What does it mean for New York if the sea level rises? What does it mean for agriculture in Spain?”
Eyeing Earth From Orbit
In 1969, the first accurate atmospheric temperature readings came from NASA’s Nimbus 3 satellite. In the decades since, satellites have surveyed the world’s forests, oceans, deserts and ice. They gather data about atmospheric gases, weather, temperature, sea level changes, ice changes and coastline changes. By stitching satellite readings to data collected from ground and aerial surveys, researchers can gain a highly accurate picture of how our planet is changing.
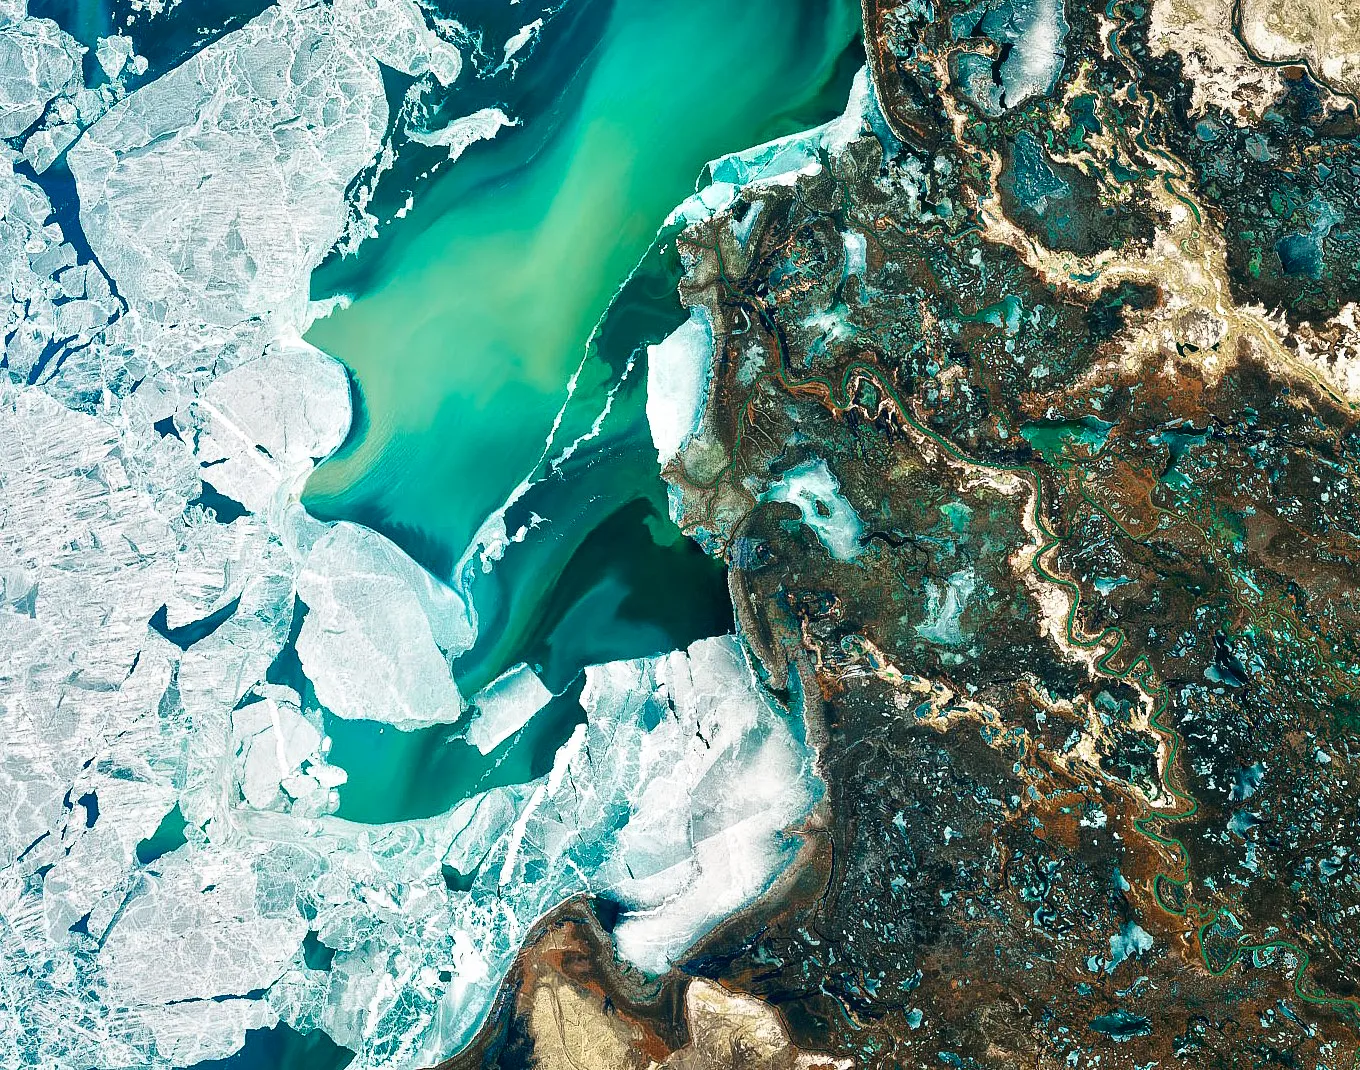
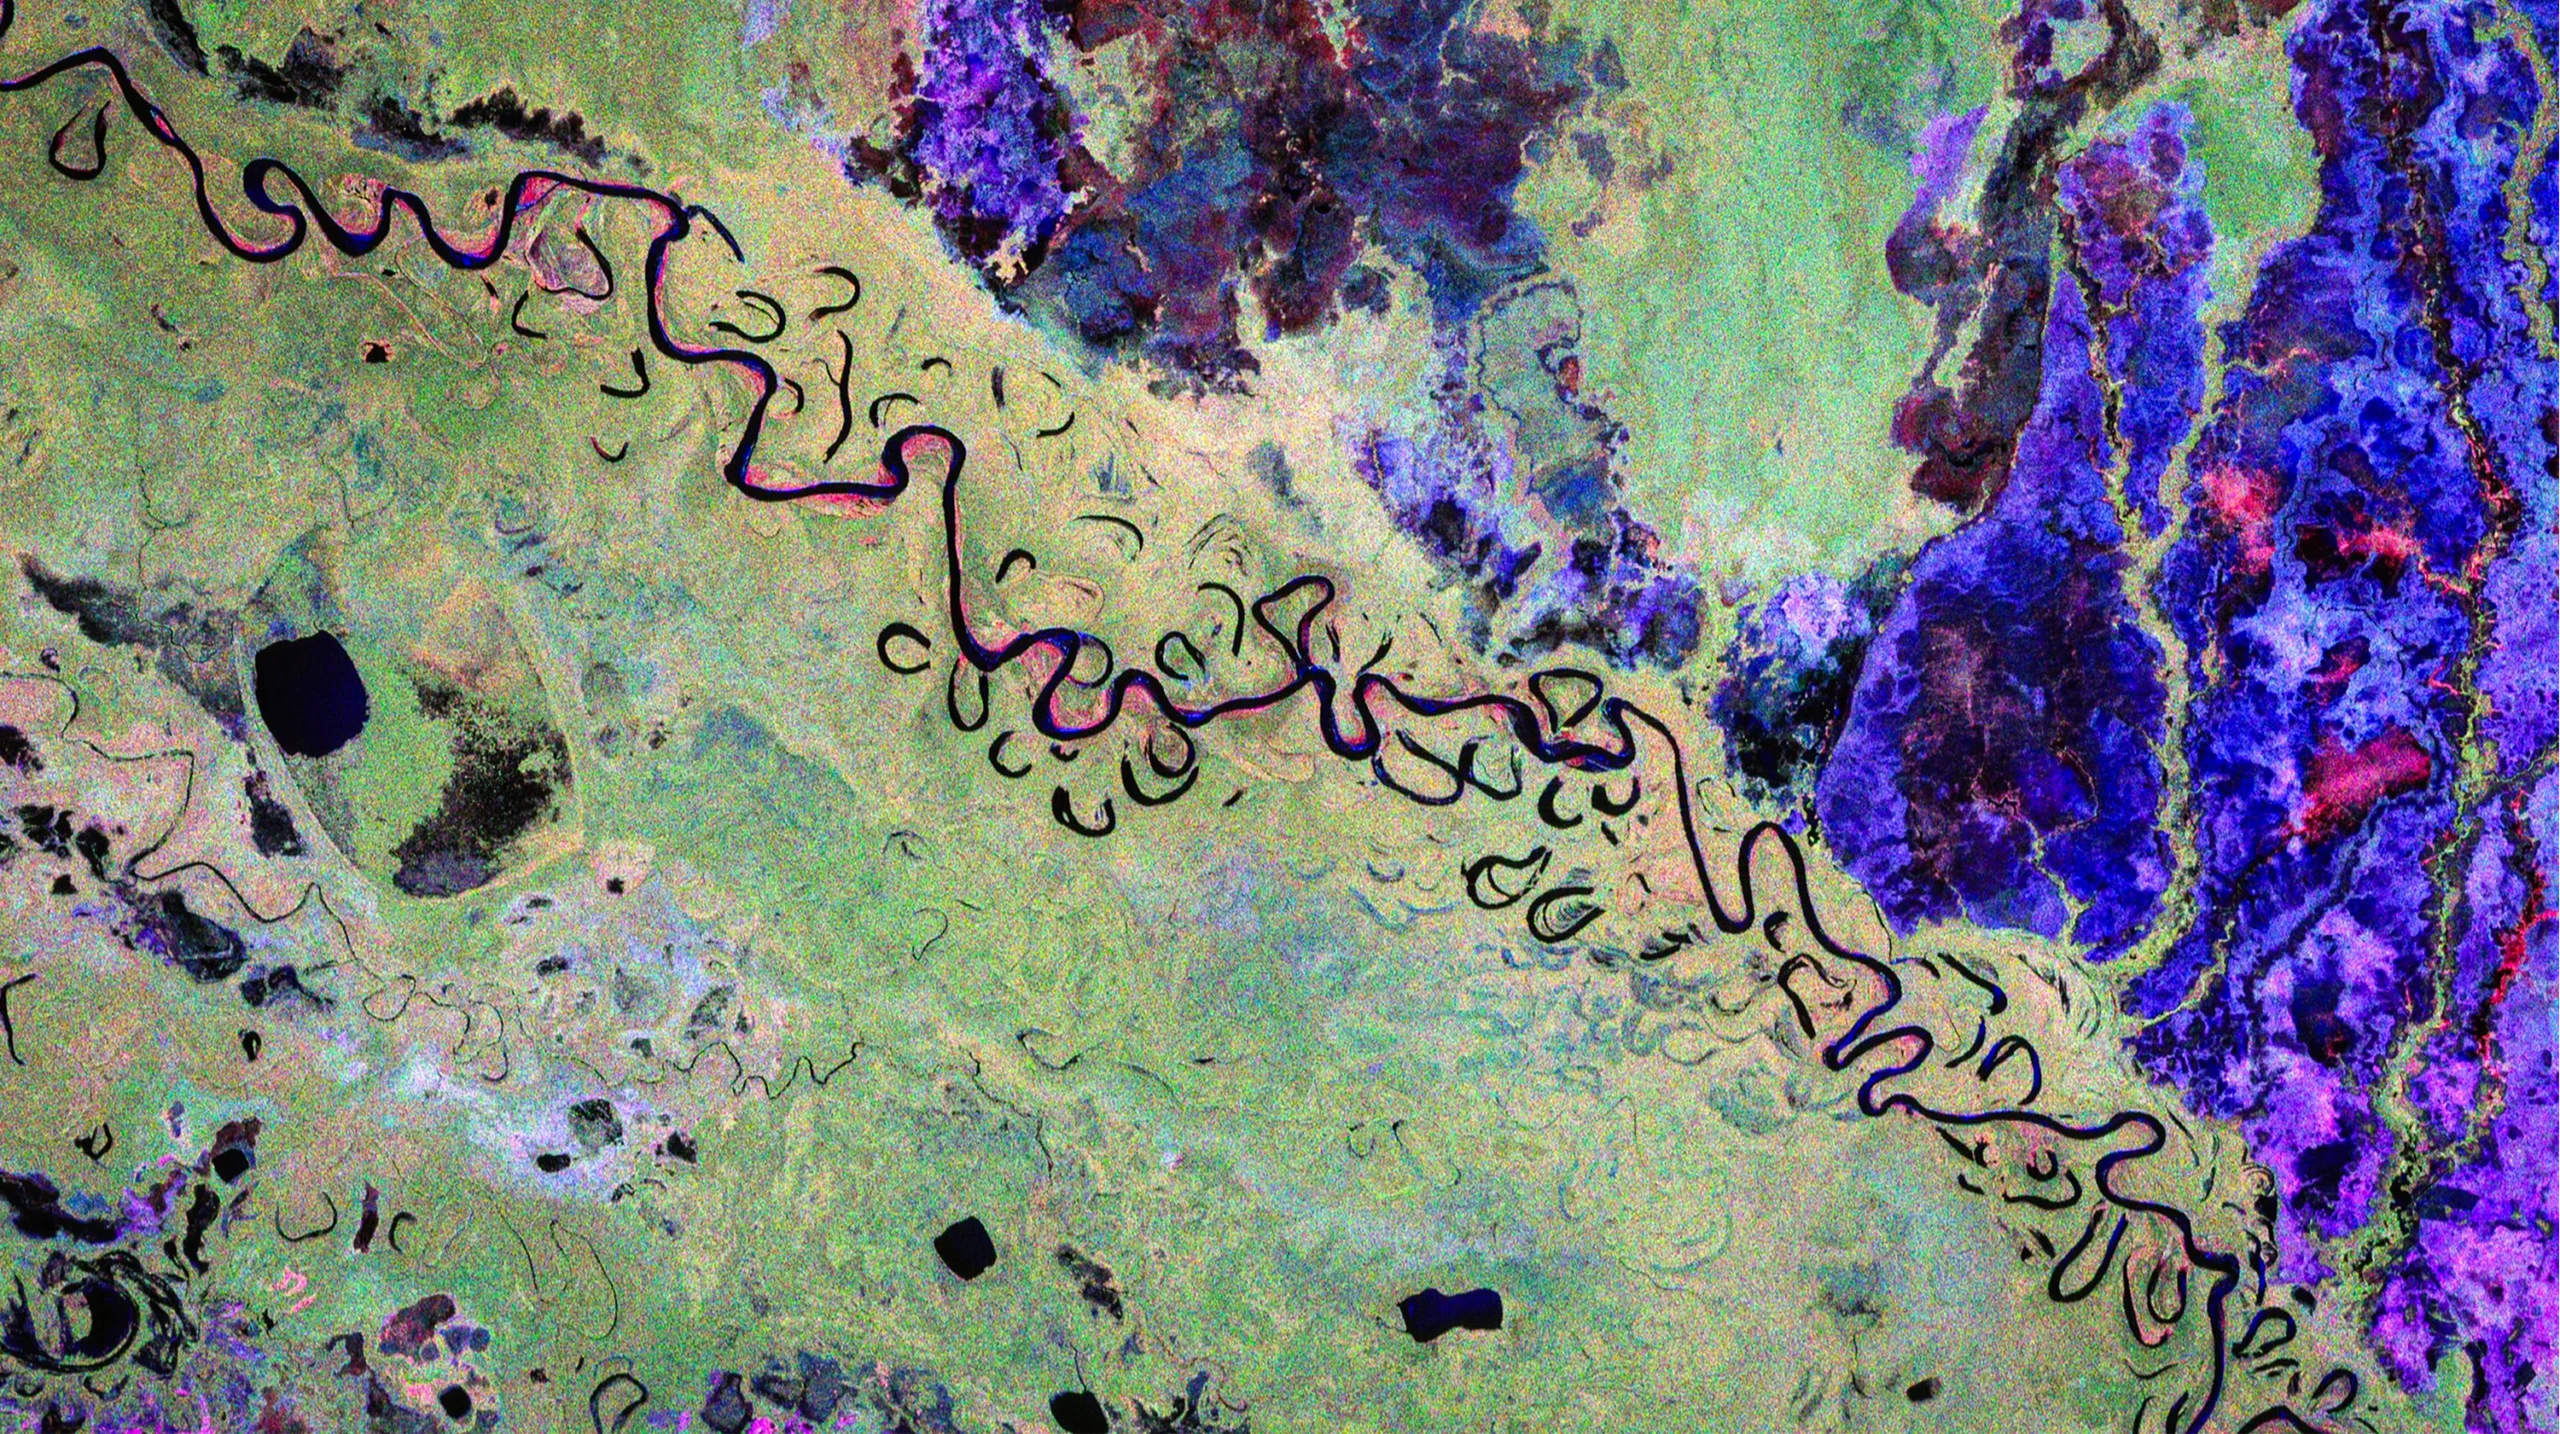
The Ili River Delta, Kazakhstan
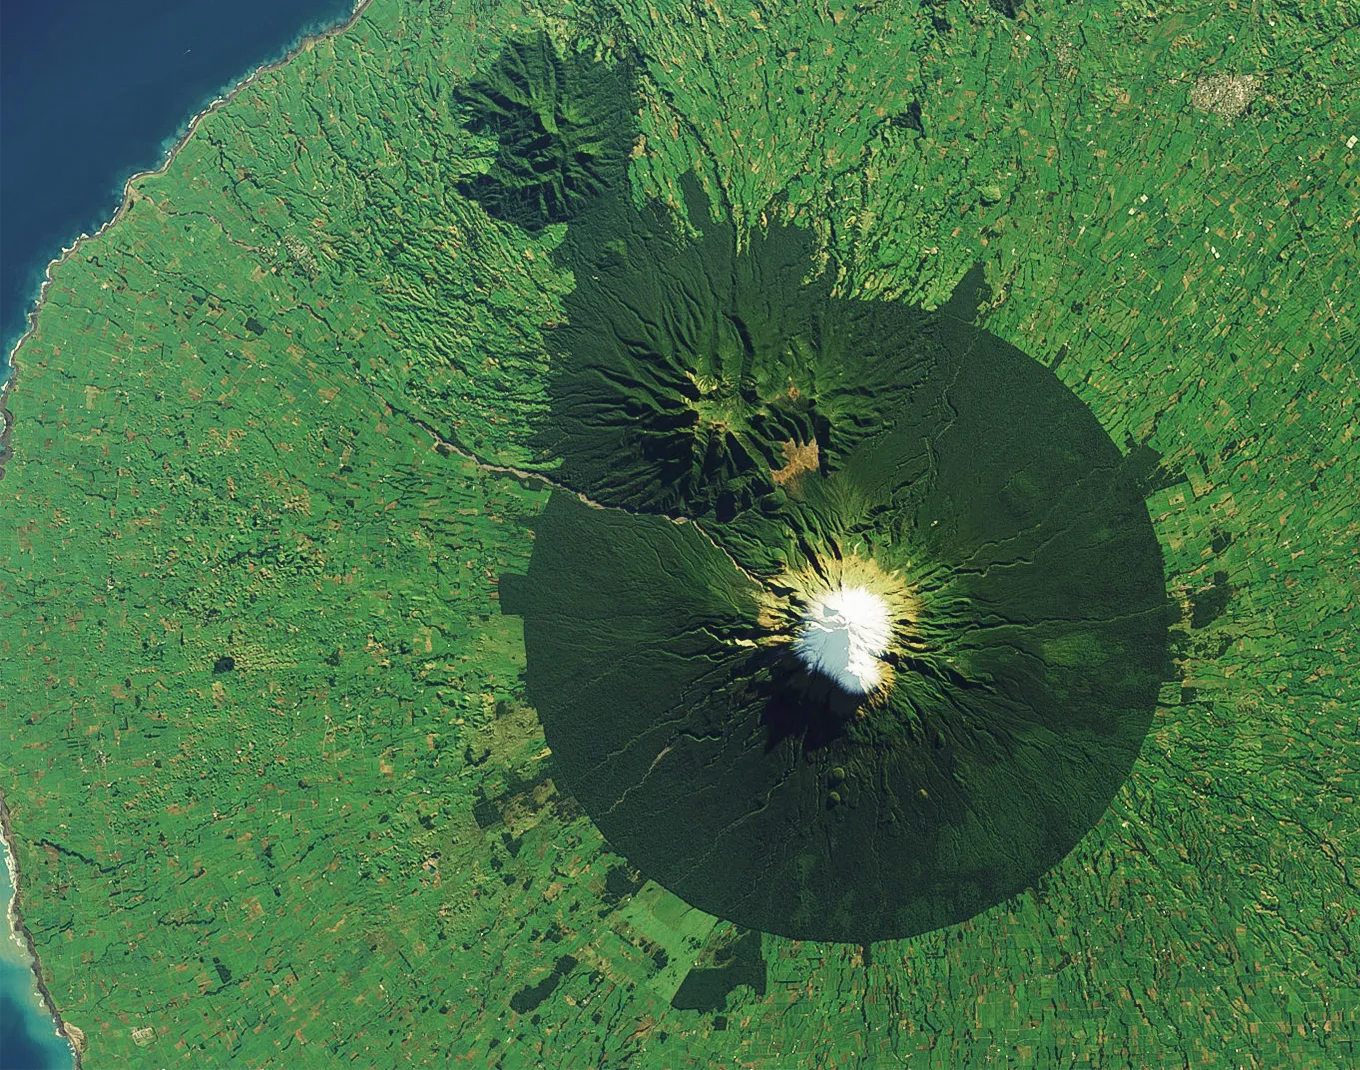
Mount Taranaki, New Zealand
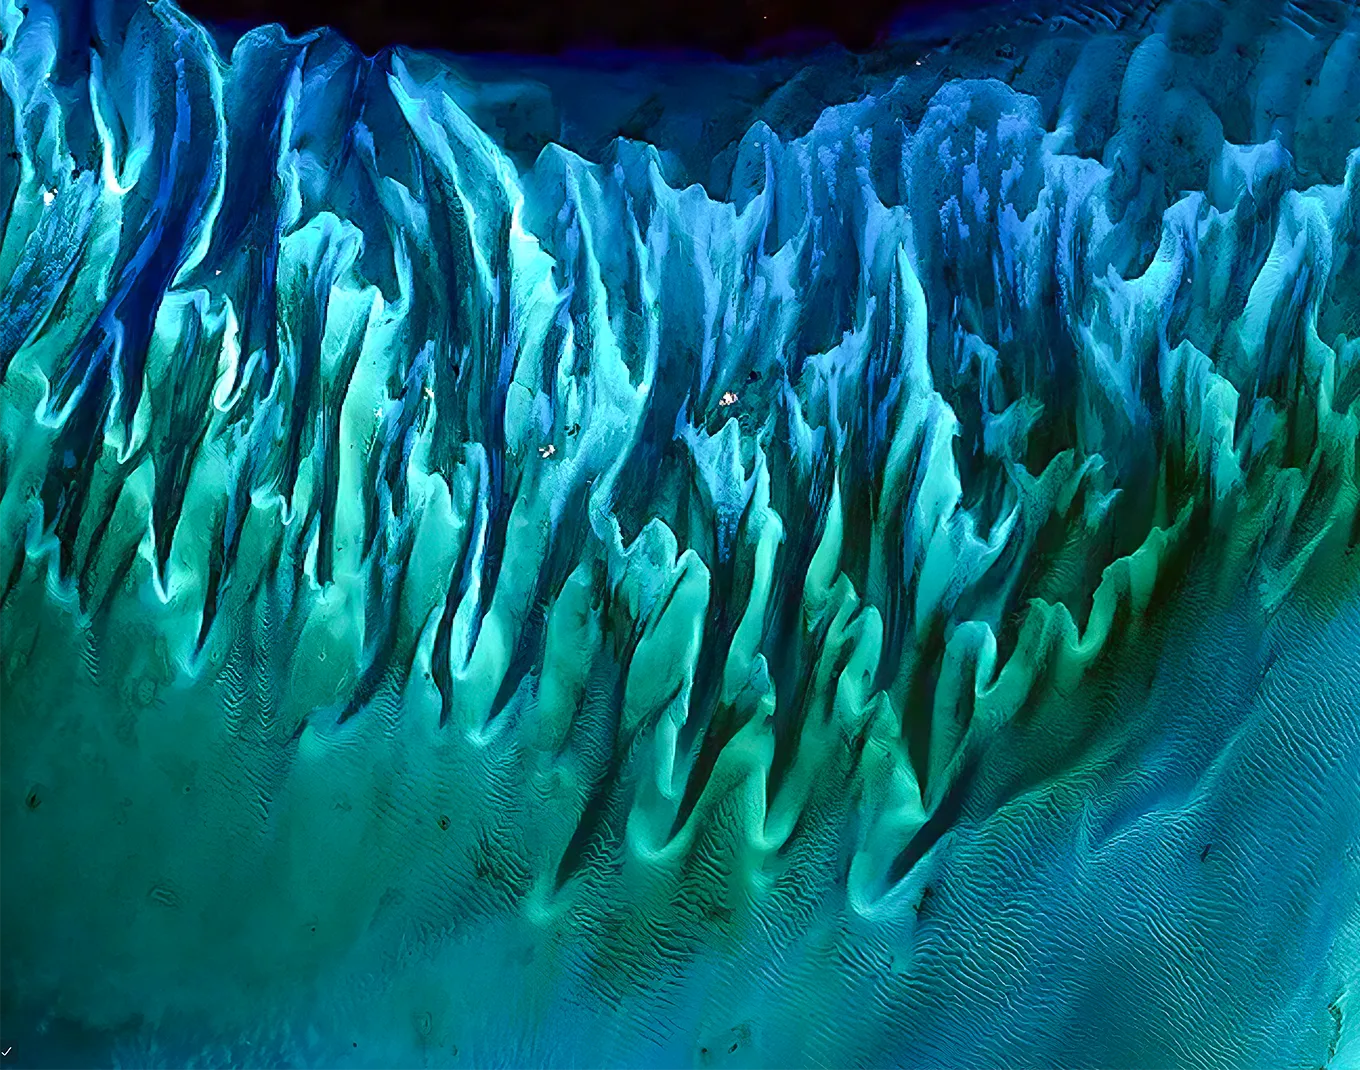
An oceanfront in the Bahamas.
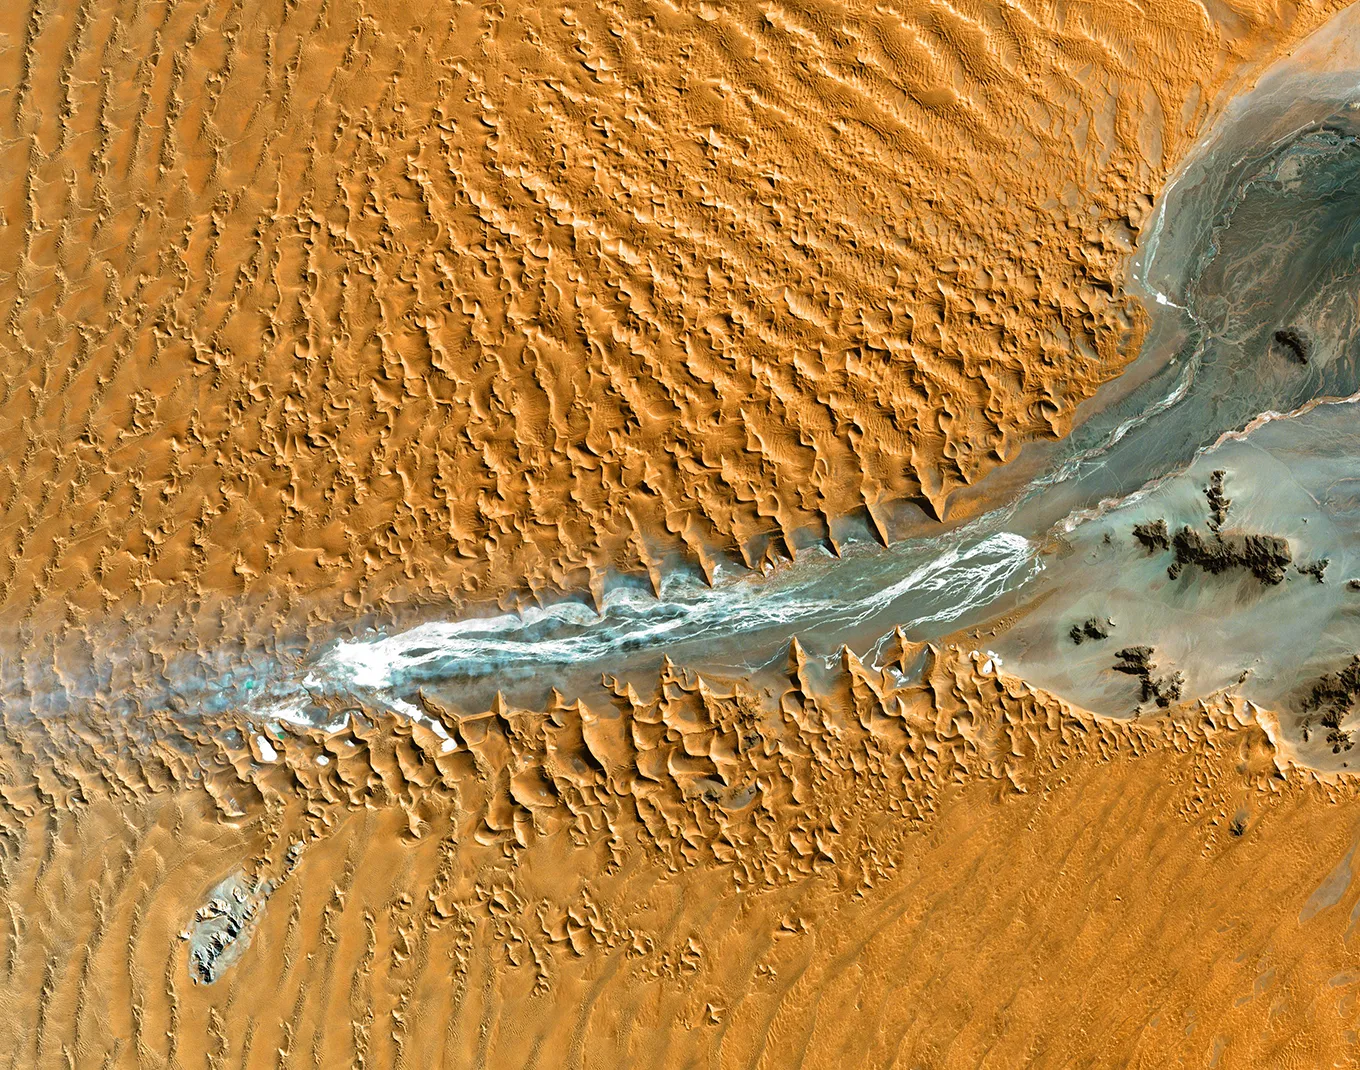
Namib-Naukluft National Park in Namibia’s Namib Desert
The European Space Agency’s Biomass satellite uses a long-wavelength radar system to see through forest canopies, such as Bolivia’s forests (pictured here), to gauge their carbon storage.
Measuring the Planet’s Breath
About 11,135 feet above sea level, on the flank of the largest active volcano on the planet, the Mauna Loa Observatory is the site of the longest continuous measurement of atmospheric carbon dioxide. In 1958, the geochemist Charles Keeling implemented his pioneering approach to measuring carbon dioxide there, which has since been implemented at other stations on land, at sea and in the air.
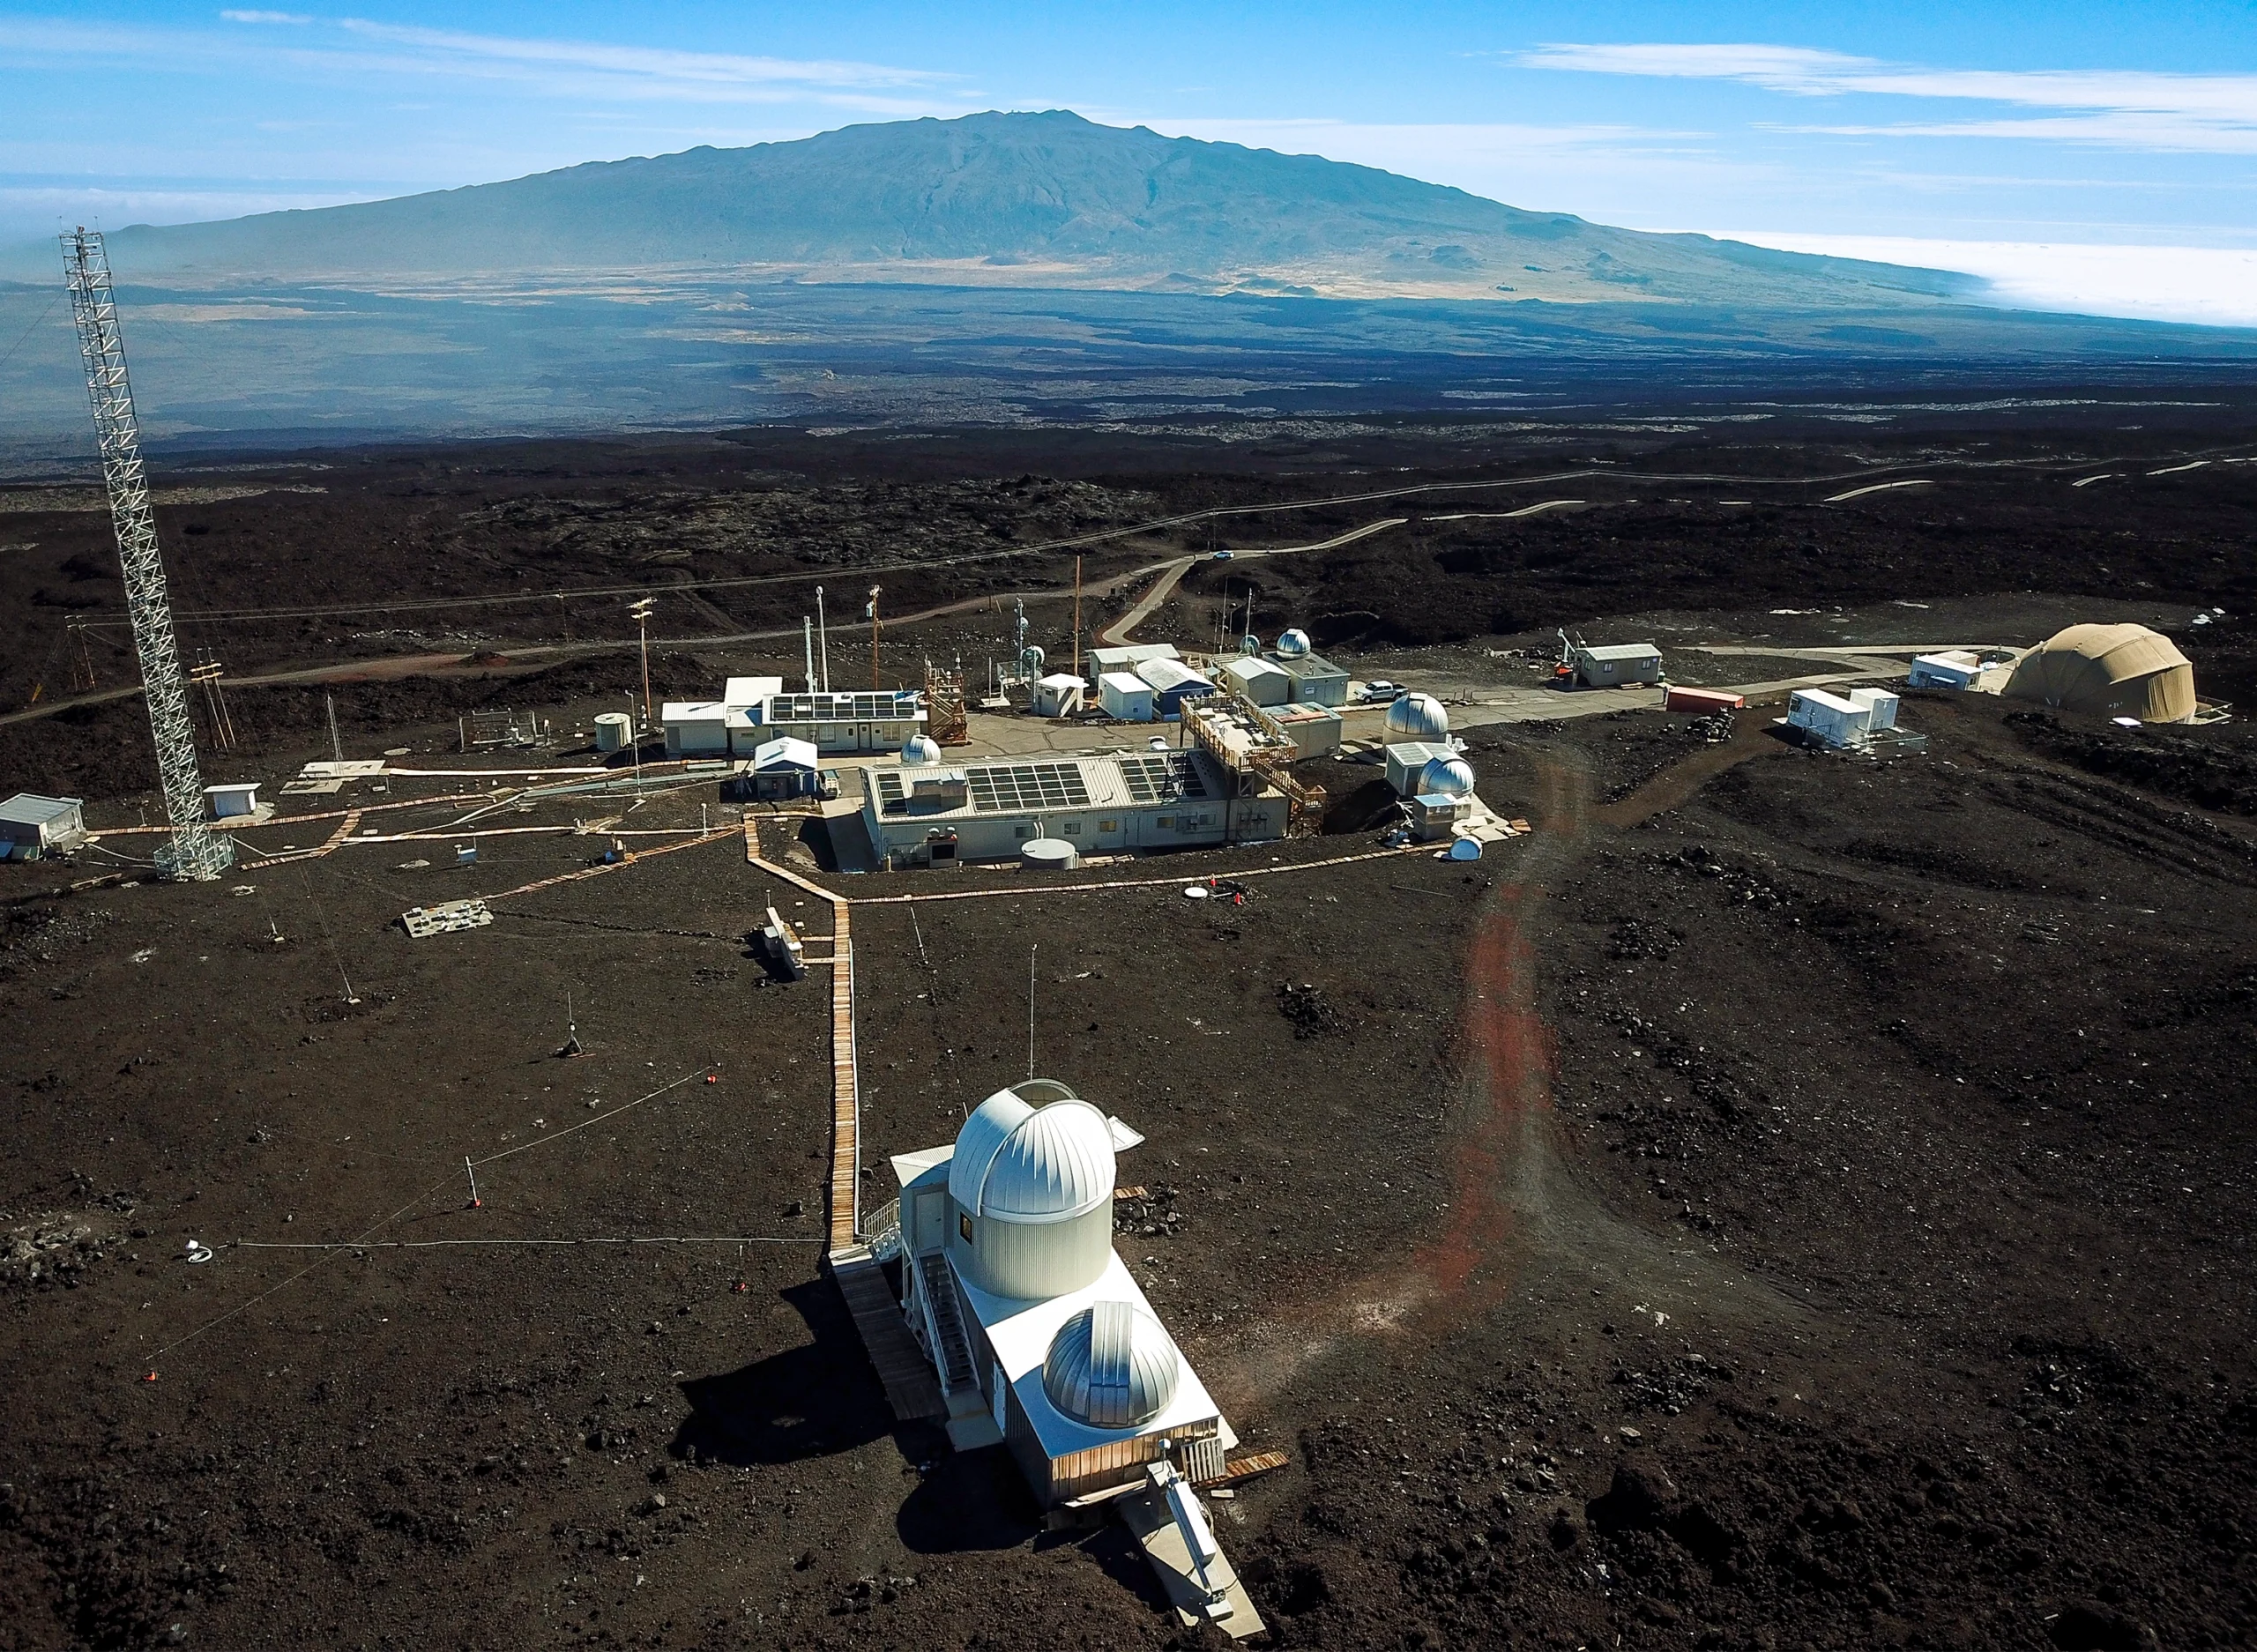
The Mauna Loa Observatory sits at around 11,000 feet on the volcano of the same name on the Big Island of Hawaiʻi.
From the measurements at Mauna Loa emerged the famous Keeling Curve, a graph that shows the steady increase in carbon dioxide deposited into the atmosphere by human activity. A 2022 volcanic eruption temporarily halted the readings; thanks to a backup station, the disruption was minimized. Now the observatory’s biggest threat is not from molten earth but from the Trump administration, whose proposed 2026 budget would shut it down, halting the research that has gathered some of the most important and conclusive evidence for carbon dioxide–driven climate change to date.
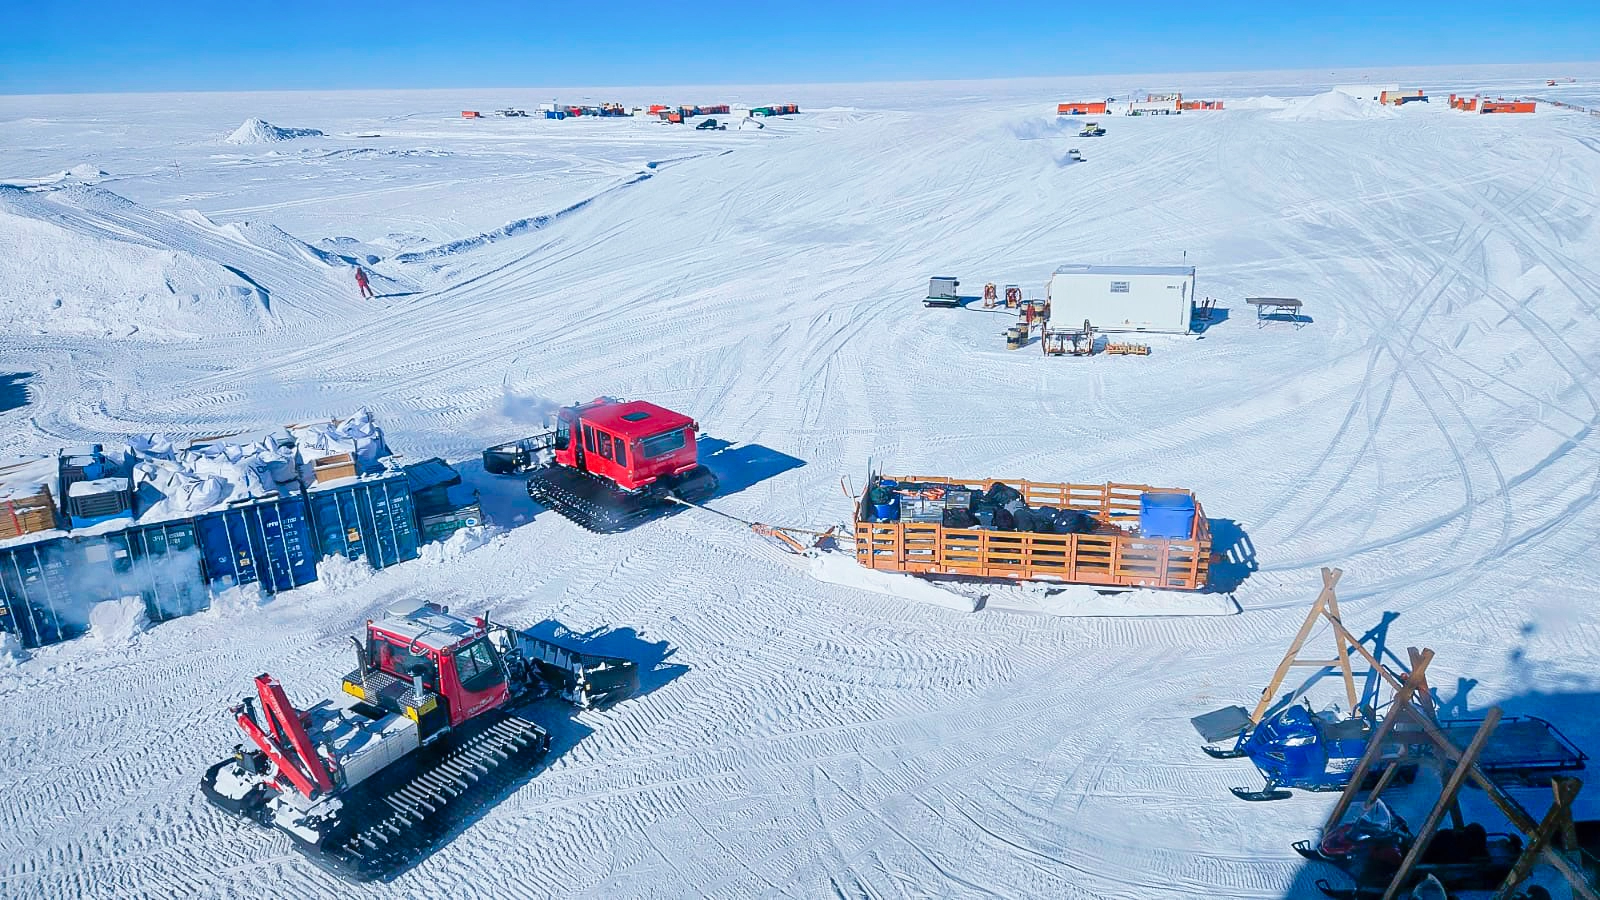
Traversing the White Continent
Above us, satellites are constantly taking stock of the Earth. But how can scientists be sure that the data is accurate? Sometimes they have to ground-truth it — even deep in Antarctica. At 88-degrees south, the orbits of NASA’s Ice, Cloud and Land Elevation Satellite-2 (Icesat-2) converge, giving this location a high density of data. So that’s where researchers had to journey to confirm its findings.
For three years in a row, researchers embarked on a two-week traverse of Antarctica. They drove 470 miles in PistenBully snowcats, which are usually used to groom ski trails. The vehicles pulled sleds with everything the researchers needed to survive for weeks in remote Antarctica, including tents and GPS instruments, as they took ground measurements of ice sheet elevation to check Icesat-2’s accuracy.
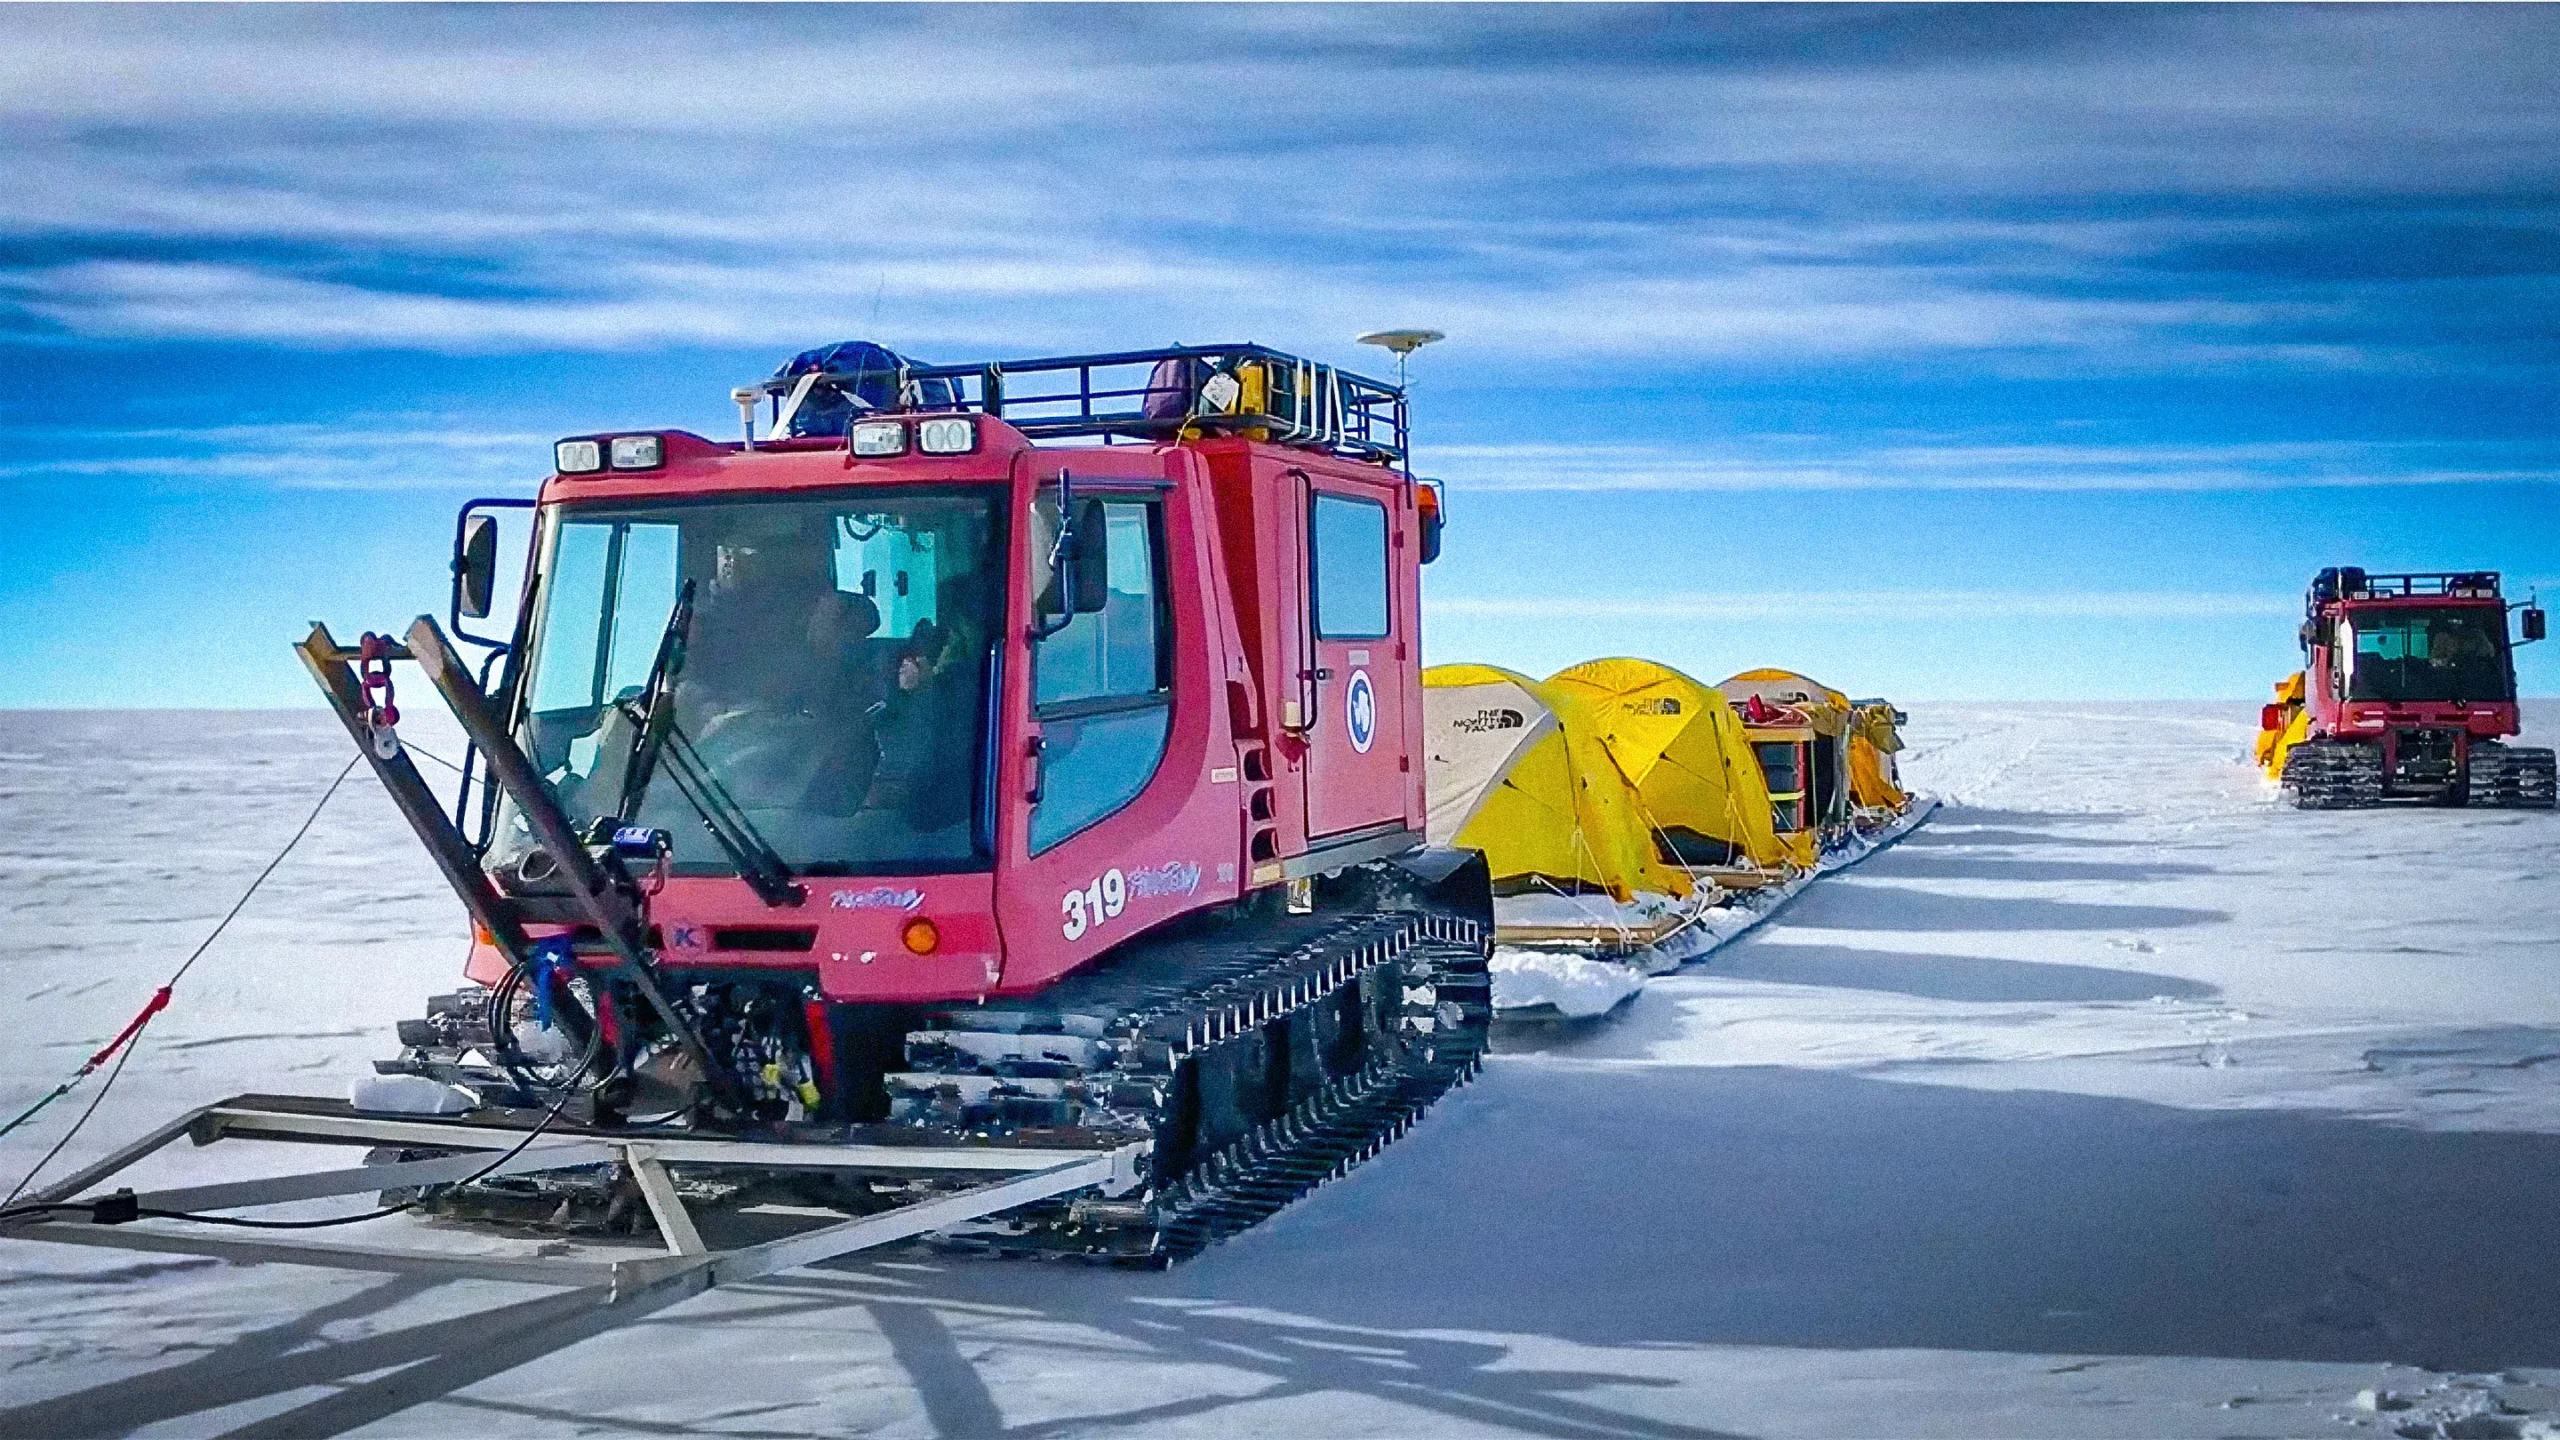
Conditions were frigid, with wind chills of minus 50 degrees Celsius. “Cold, dry air fills your nose and lungs. Your eyes blink, trying in vain to bat away the overwhelming brilliance of sunlight reflecting off the snow,” wrote the researchers Adam Greeley and Kelly Brunt in field notes describing their arrival on the continent in 2018. The scientists had their fun, however. For Christmas in 2020, they cooked up a nice dinner and the next day hosted a “race around the world” — a 2-mile race across every longitude line. Two winners were awarded 10-minute showers (rather than the allotted two minutes).
Recording Damage
Climate science is not limited to professionals. Volunteers around the world are documenting changes in their communities, such as effects on bird populations or cultural sites. In Florida, the Heritage Monitoring Scouts visit archaeological sites, including cemeteries, forts and mills, to record any impacts after extreme weather events. Hurricanes, for instance, send storm surges and strong winds inland, causing erosion and other damage. “The health of the archaeological sites can also speak to the health of the environment,” said Sarah Miller, a regional director for the Florida Public Archaeology Network in St. Augustine.
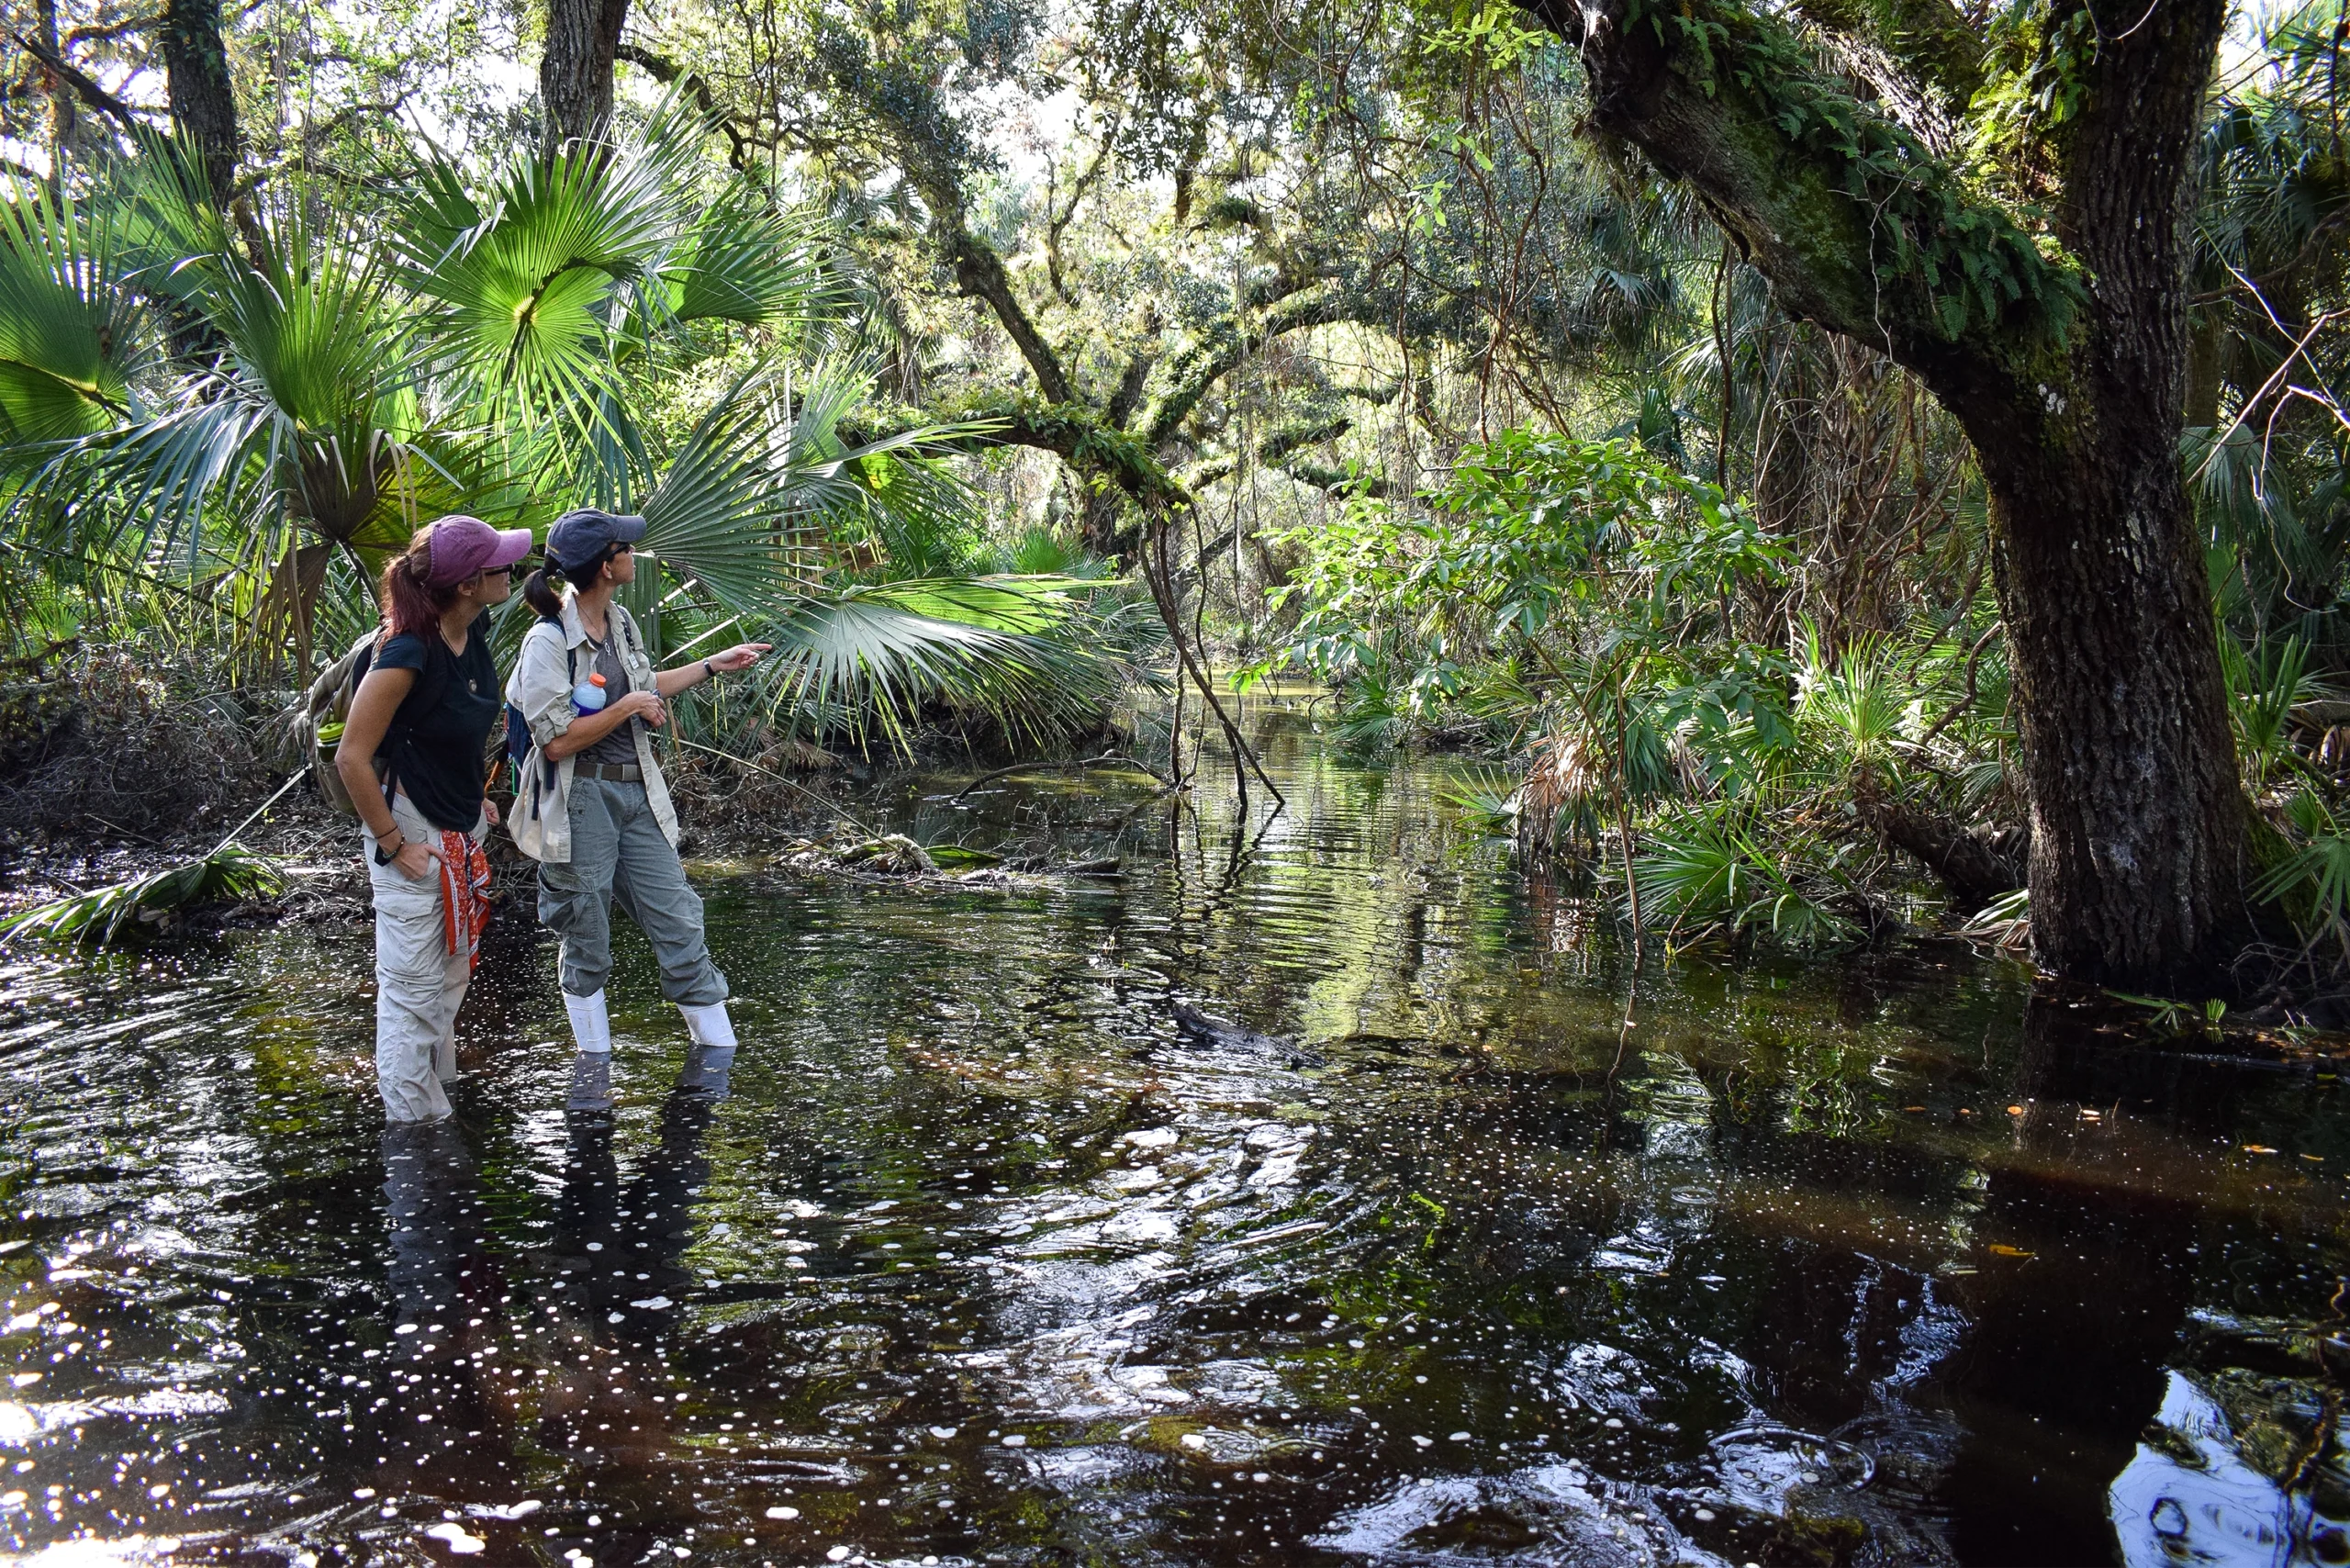
Heritage Monitoring Scouts assess a flooded moat at Fort Center, an archaeological site in Glades County, Florida, after Hurricane Irma struck in September 2017.
Flying Over Changing Landscapes
Between 2009 and 2019, aircraft with NASA’s Operation IceBridge took to the skies with lasers, radar, optical and infrared cameras, gravimeters, and magnetometers to precisely survey changes in the planet’s polar ice. Across more than 1,000 flights, the aerial surveys collected sea ice and glacier measurements, including height, depth, thickness and ice flow. This data helped map changes on the surface of the ice and also in the invisible parts — the glacial bottoms, the bedrock of Greenland and the inside of the ice itself — to track and model melt dynamics.
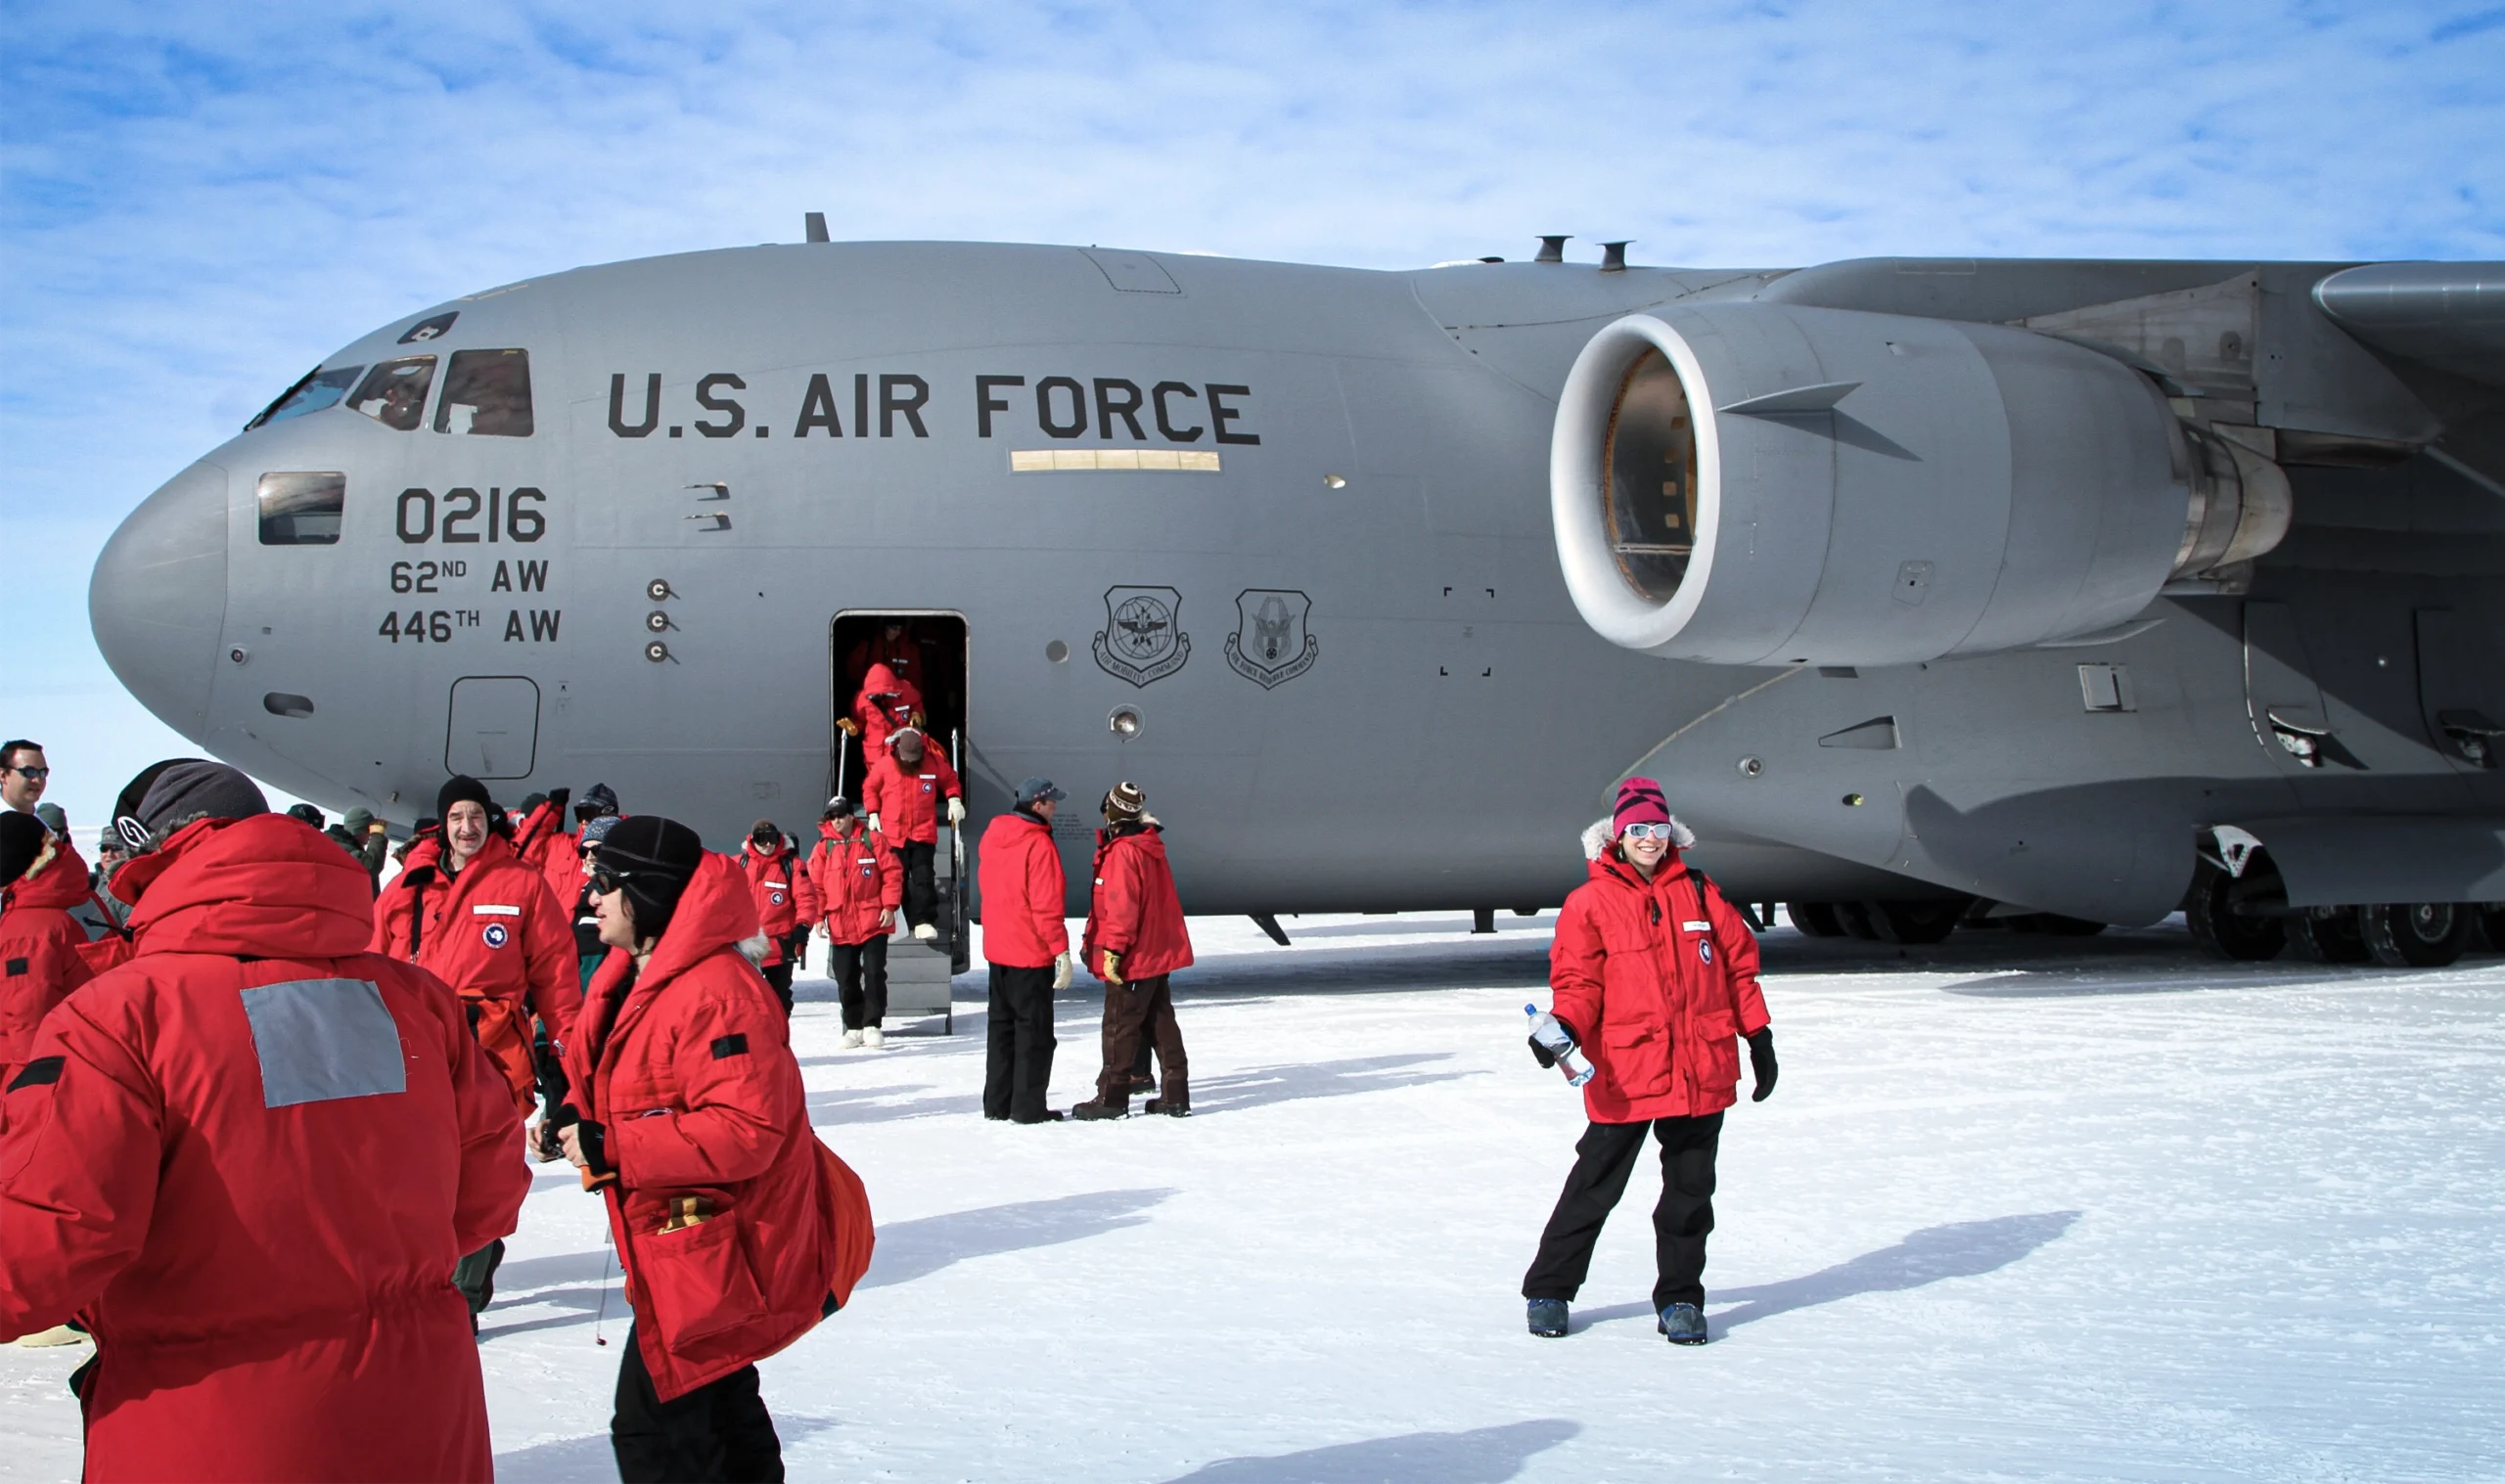
In November 2013, a U.S. Air Force C-17 aircraft dropped scientists off at McMurdo Station in Antarctica.
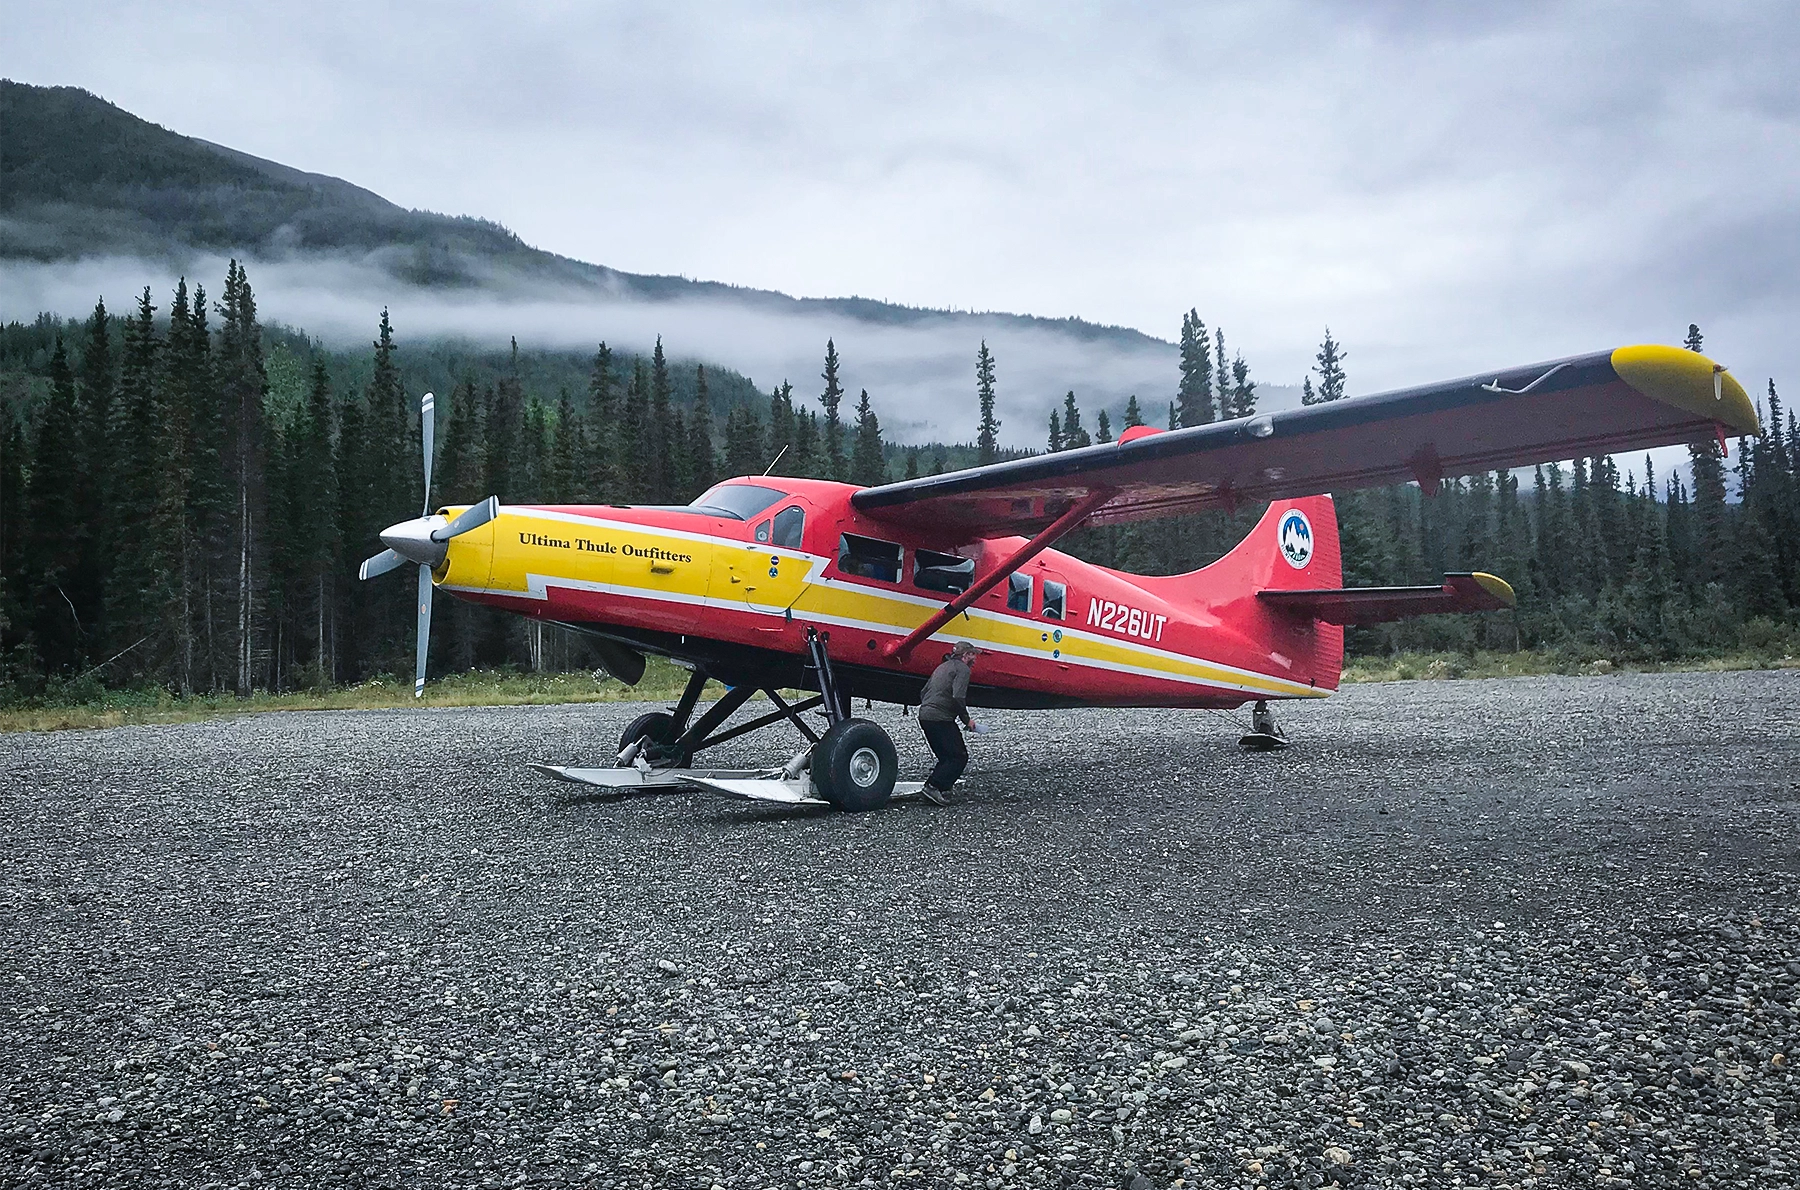
Bush pilot Paul Claus flies scientists in a single-engine de Havilland Otter to collect data on mountain glaciers.
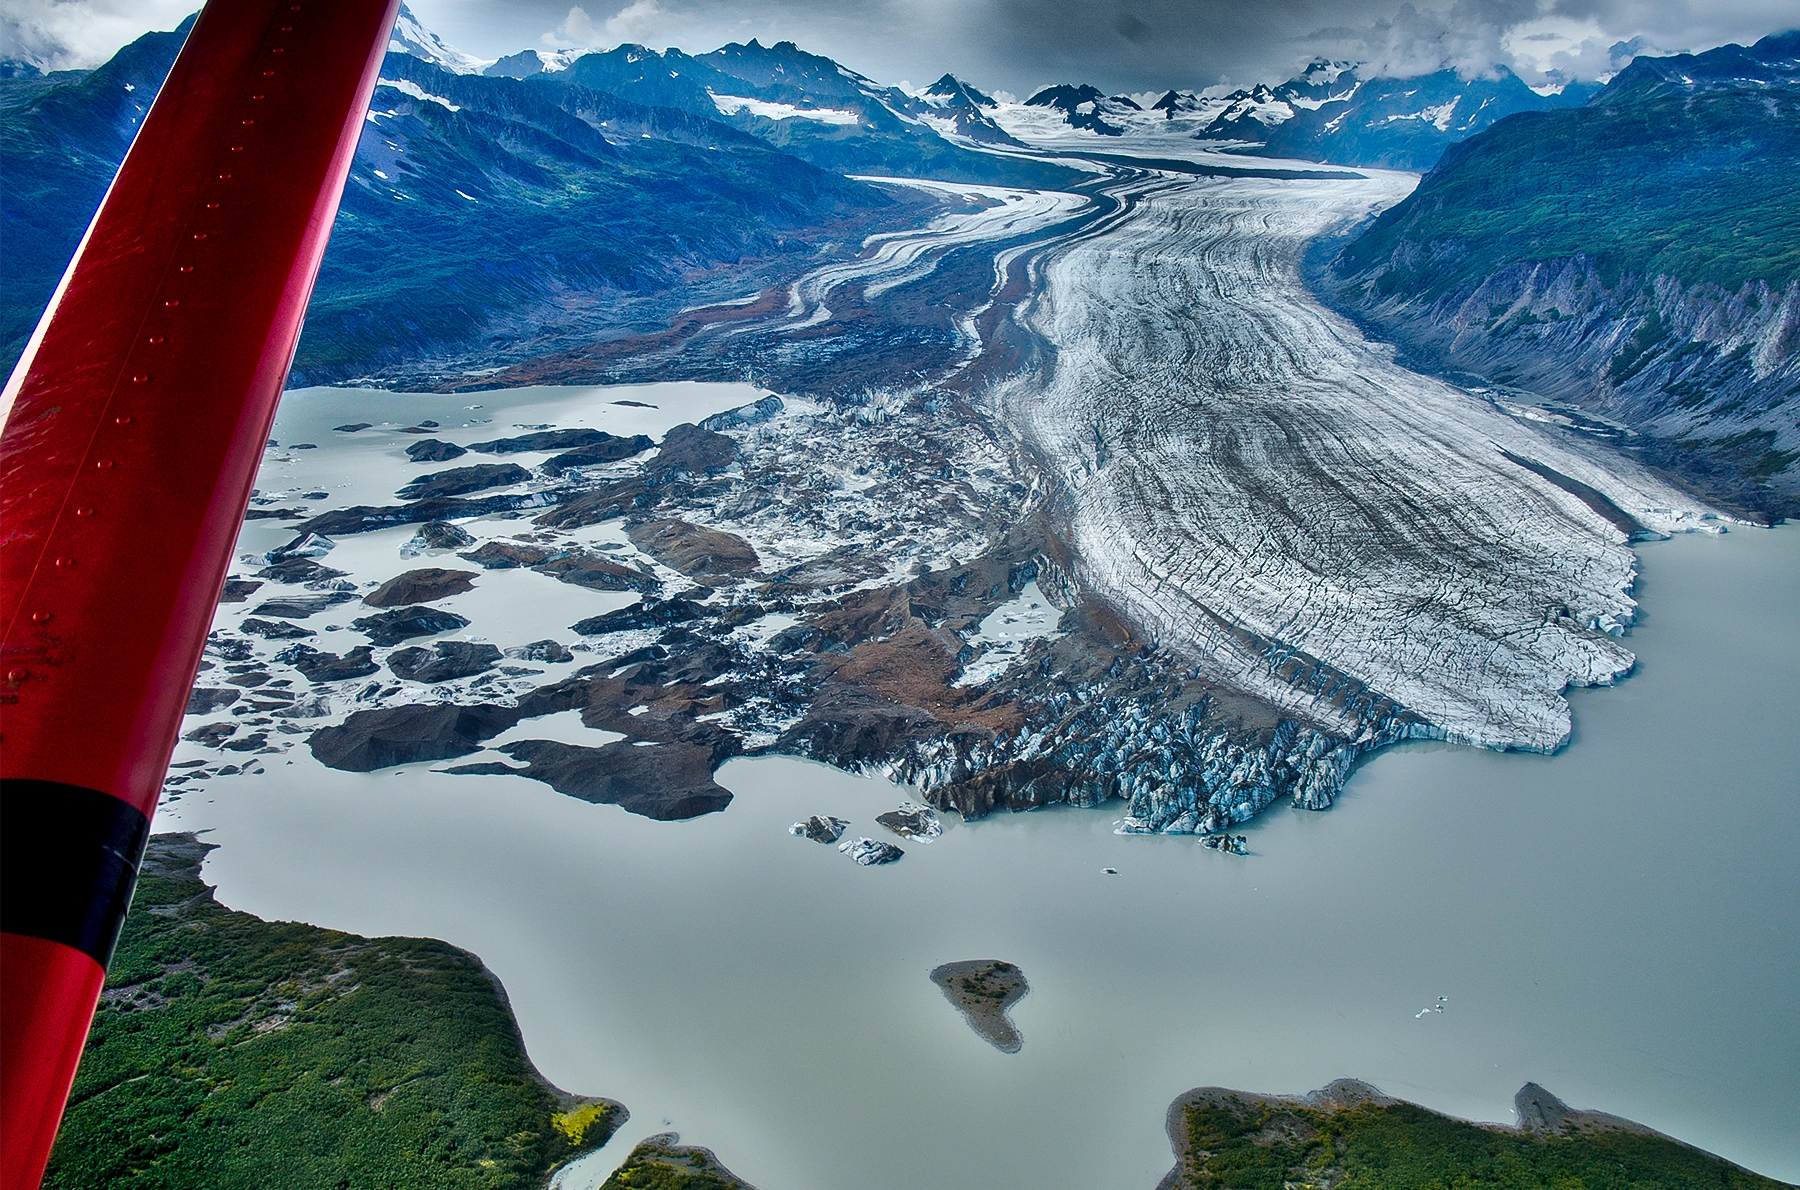
In August 2018, Operation IceBridge flew over Sheridan Glacier in Alaska.
Drifting With the Ice
In subzero temperatures, under the dark of polar night, nearly 100 people drifted on a piece of ice for close to a year. Their eyelashes often froze. They worked in near-complete darkness, illuminated only by moonlight, headlamps and the light from their ship. Occasionally a curious polar bear meandered near camp, which was always changing as the ice floe buckled and drifted across the Arctic Ocean.
The dedicated researchers worked through these harsh conditions to study a place exceptionally vulnerable to climate change — the Arctic is warming faster than anywhere else on Earth — and its influence on the rest of the world. Models for how climate change will affect the Arctic are largely based on data collected in the 1980s, said Marcel Nicolaus, a sea ice physicist who coordinated the sea ice program for Mosaic (Multidisciplinary Drifting Observatory for the Study of Arctic Climate), a scientific expedition that took place between September 2019 and October 2020. By taking simultaneous measurements from ice, ocean and atmosphere, Nicolaus and his colleagues hoped to update their understanding of how these different parts of the ecosystem interact and to improve their models and predictions.
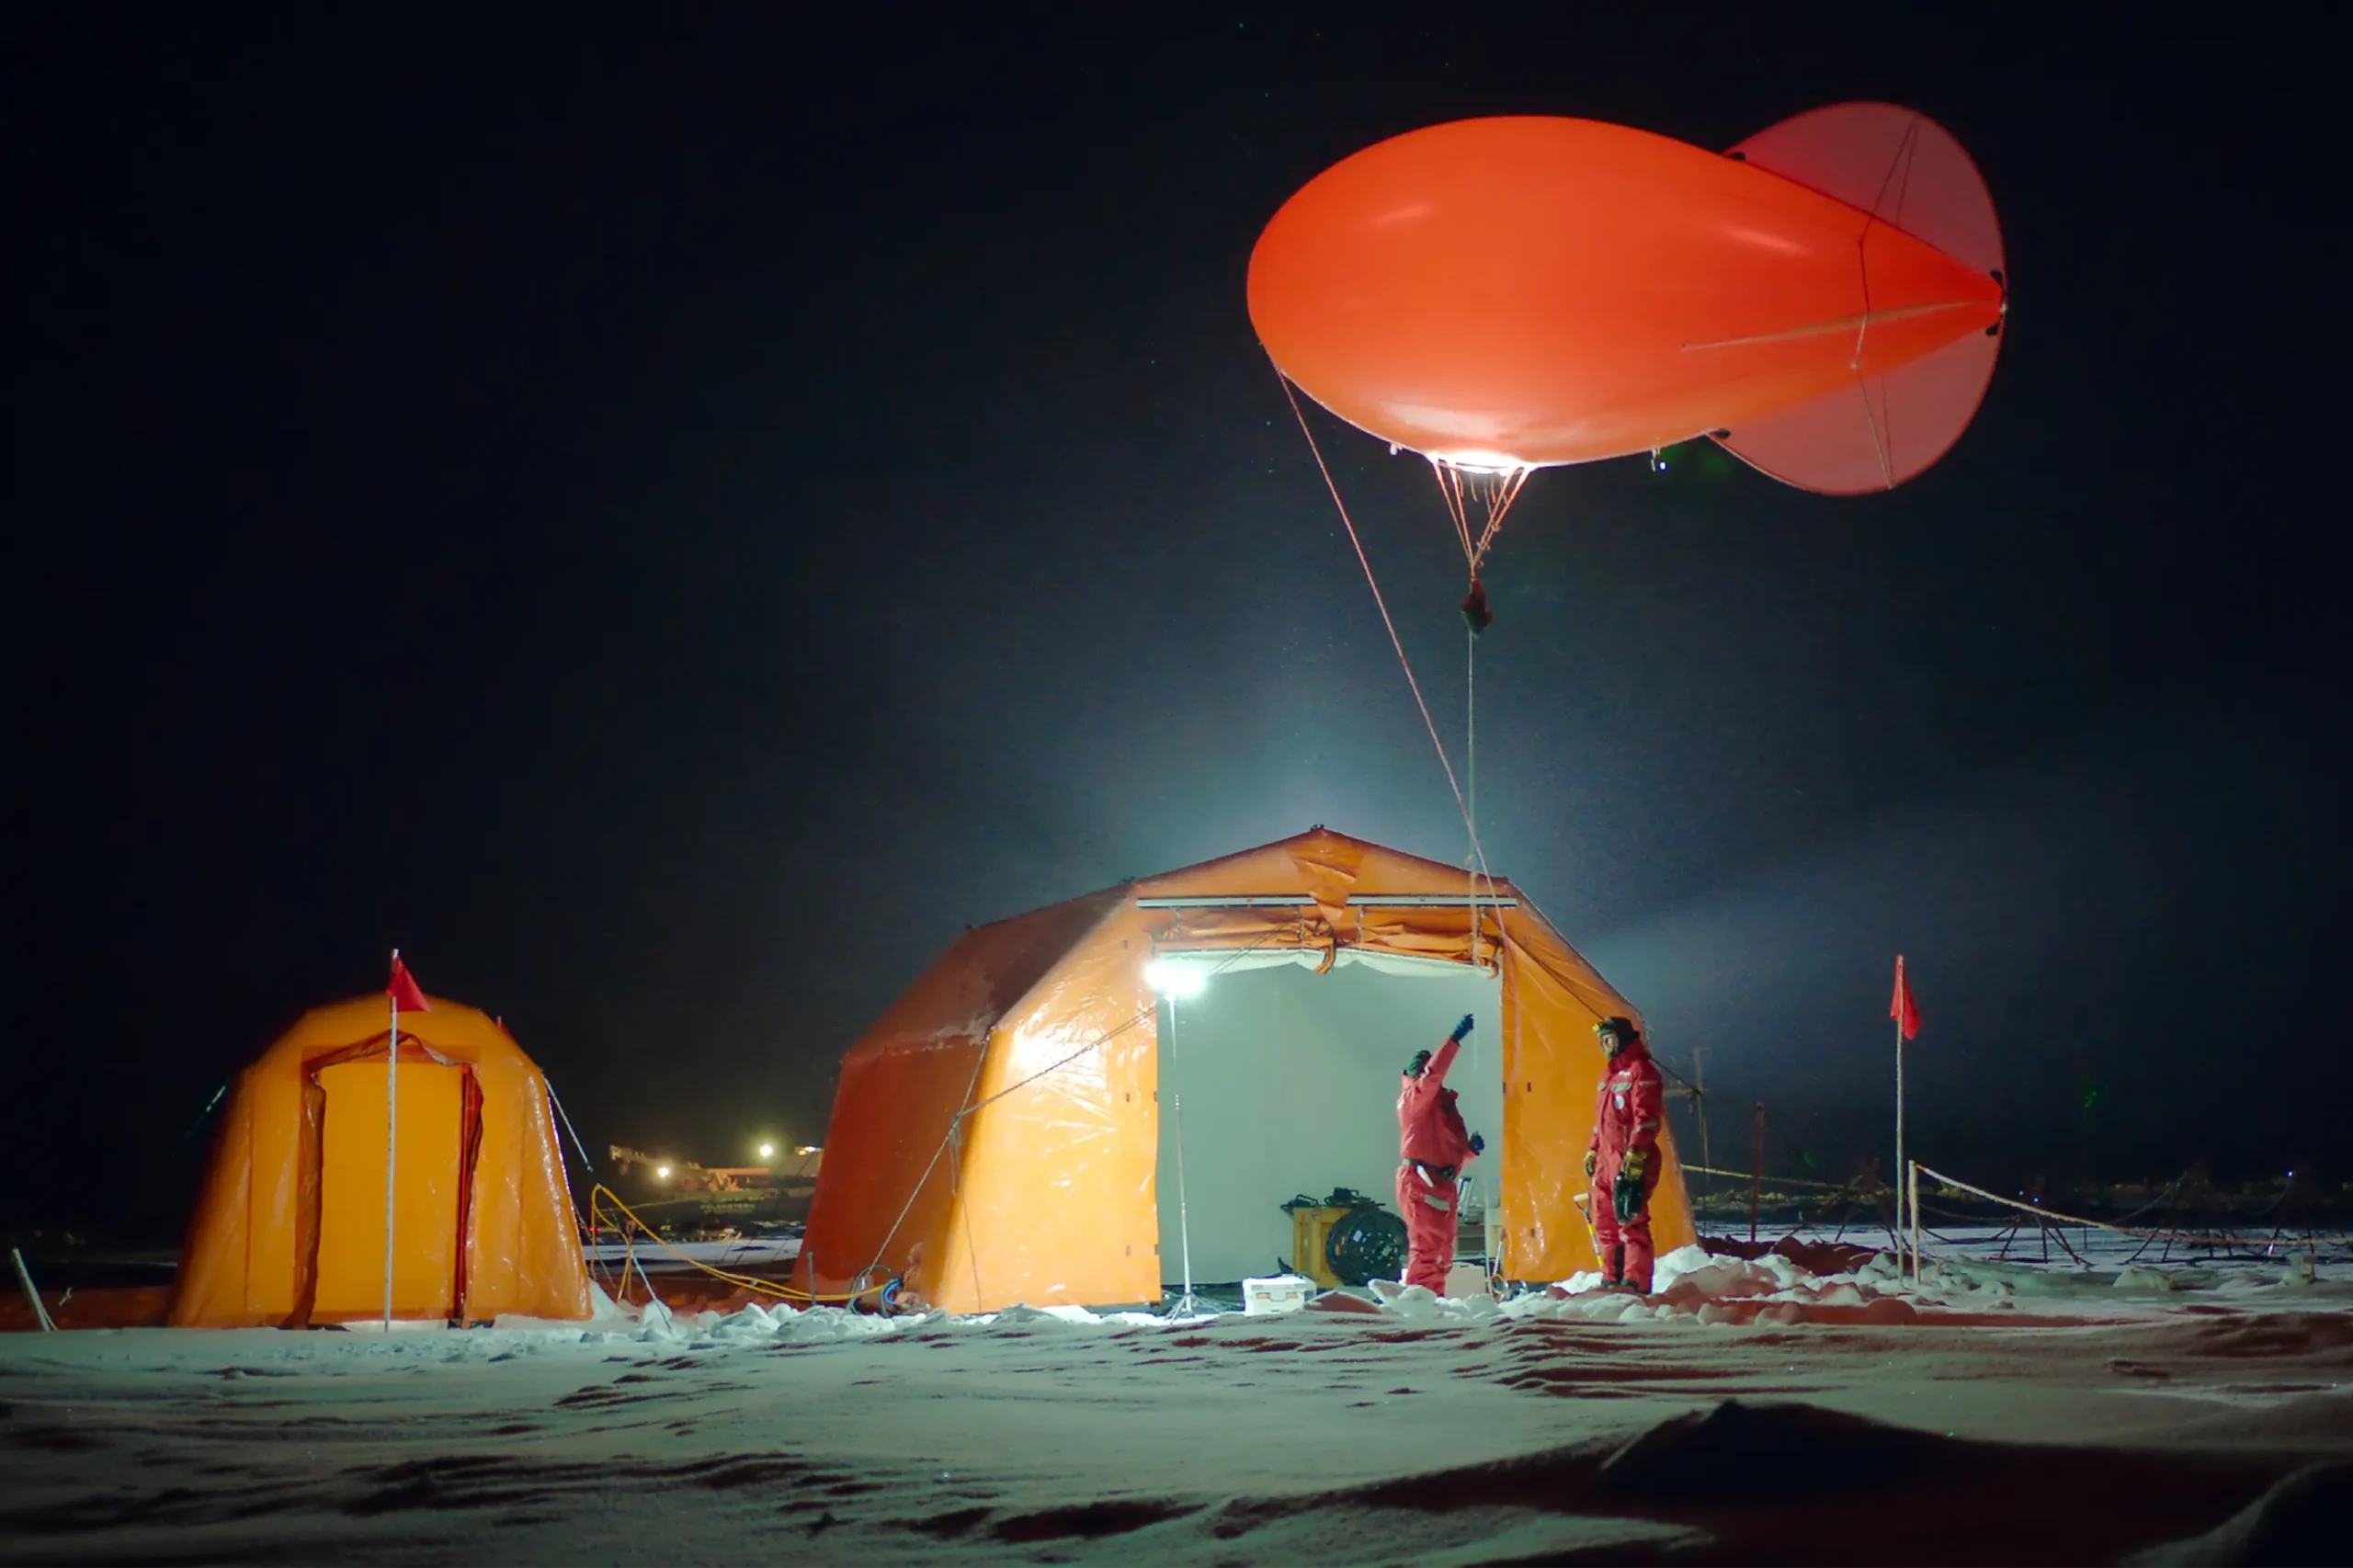
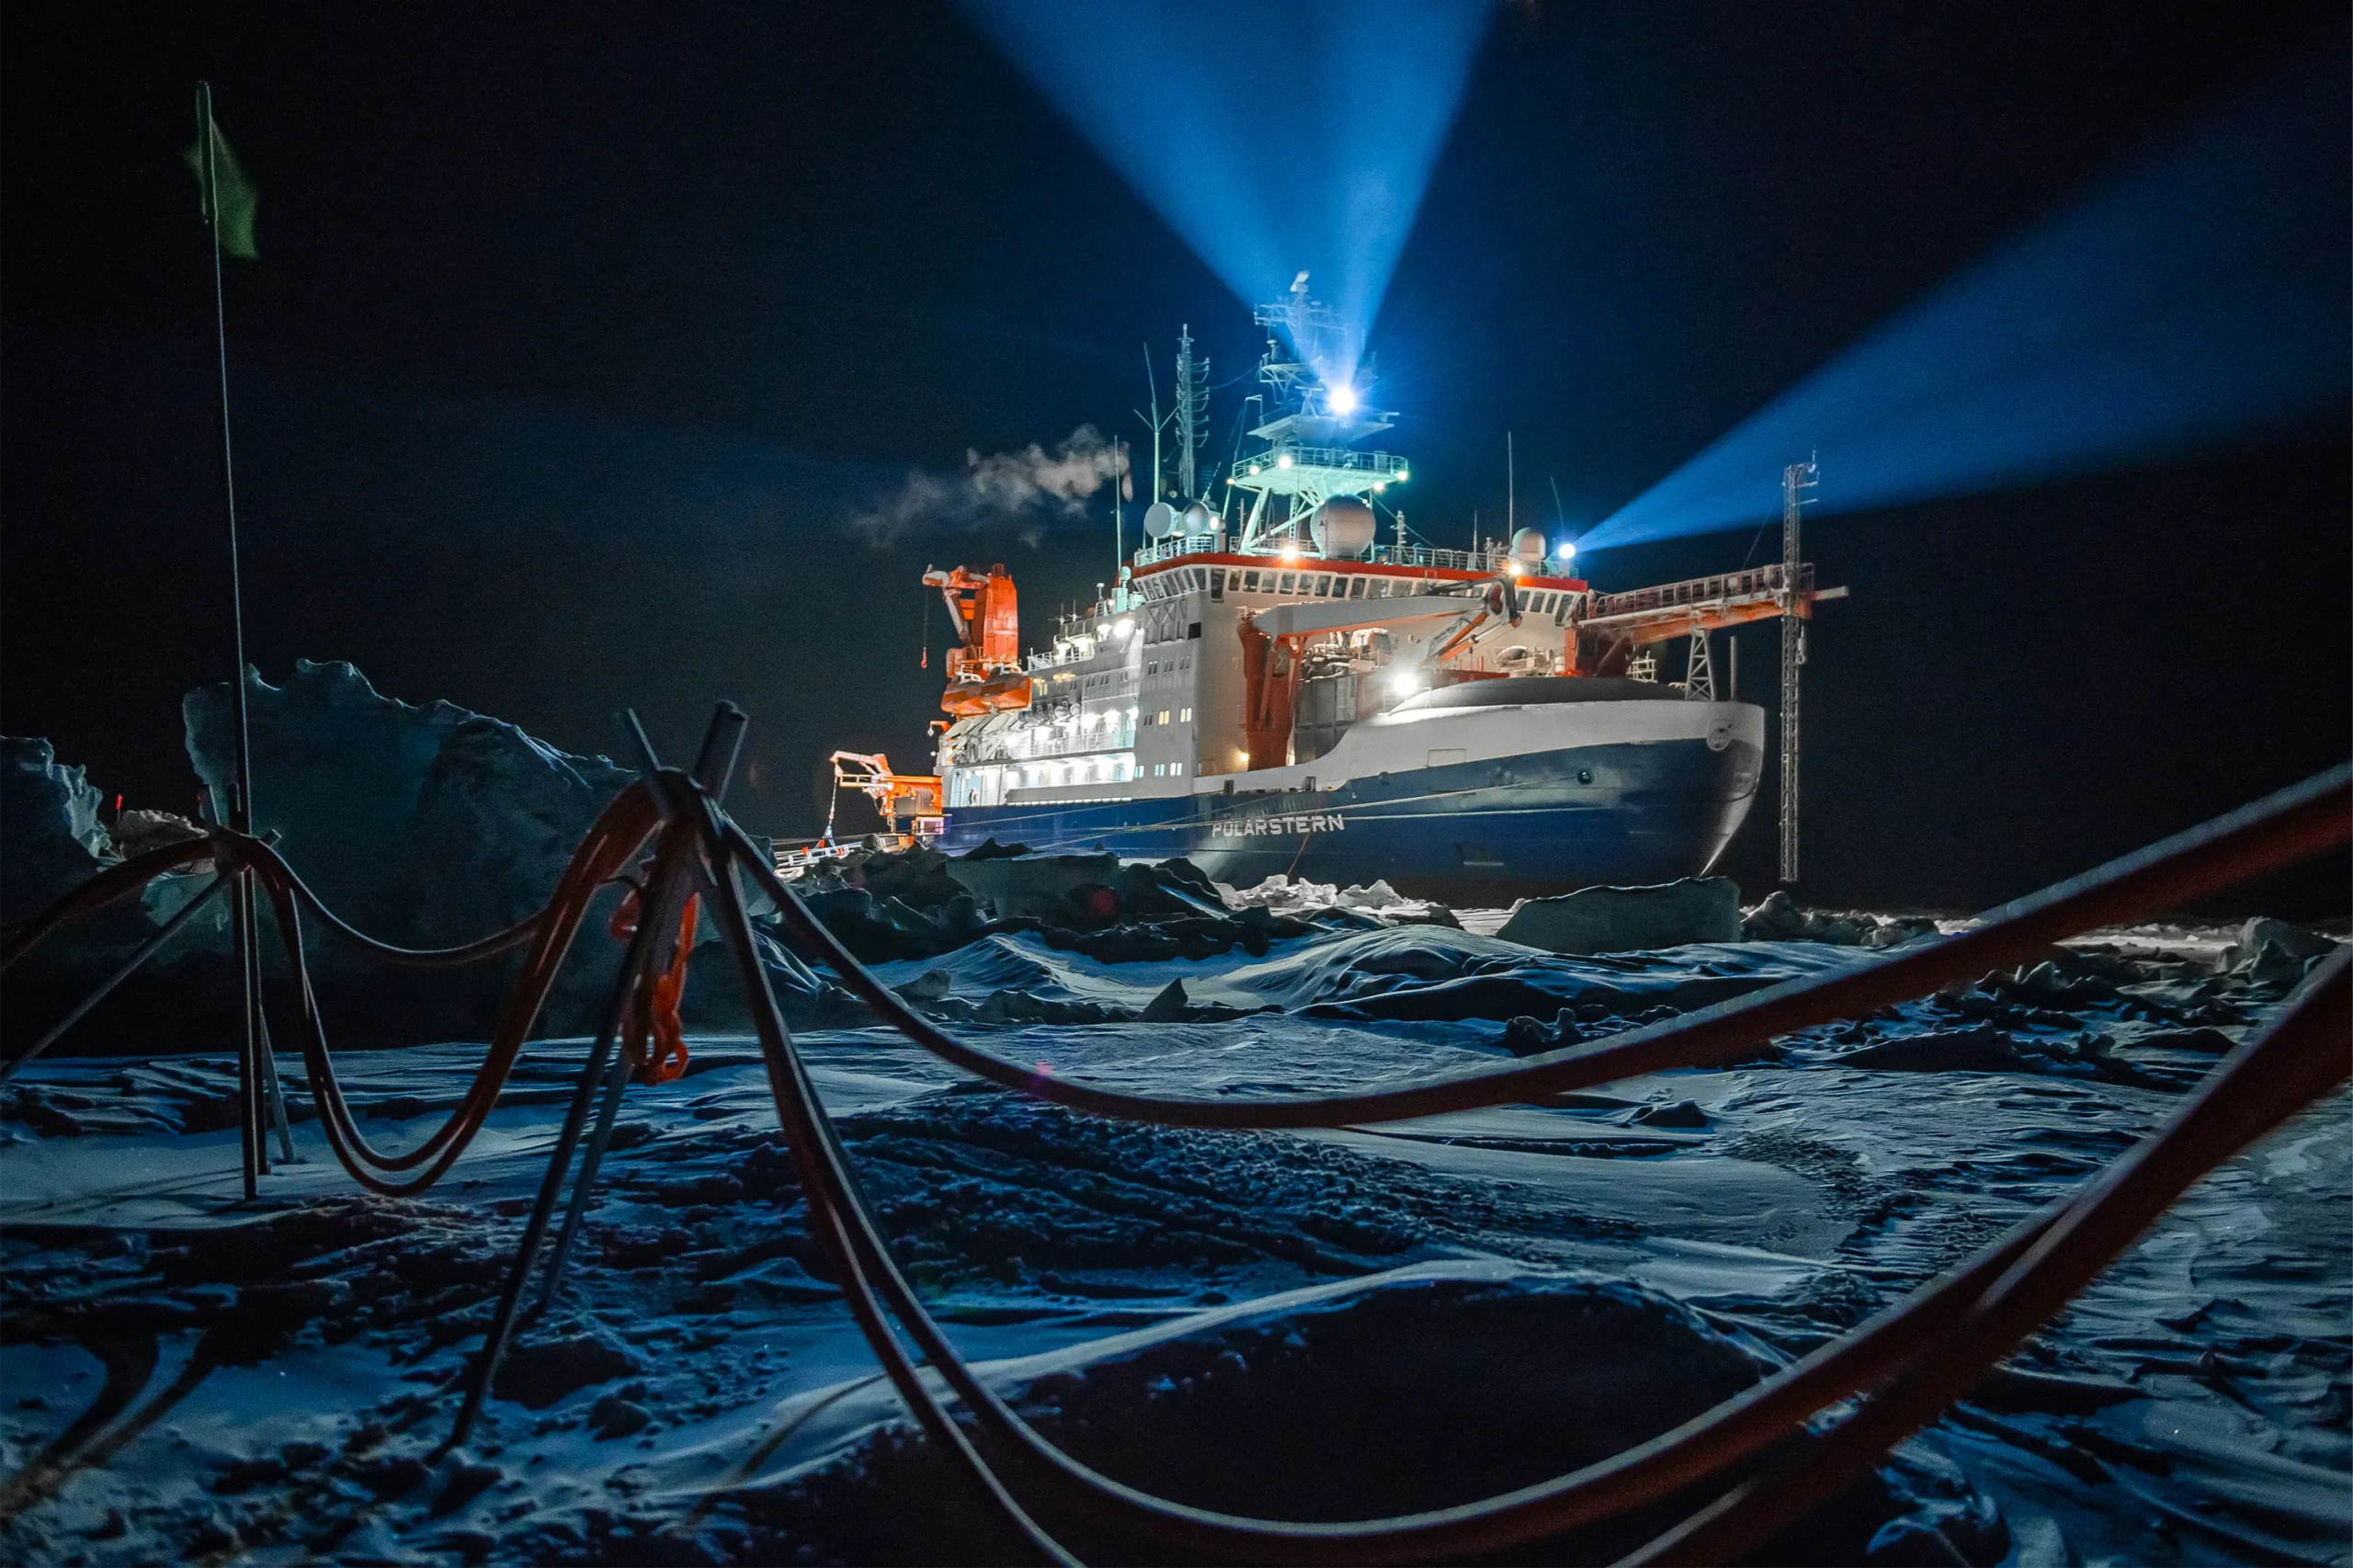
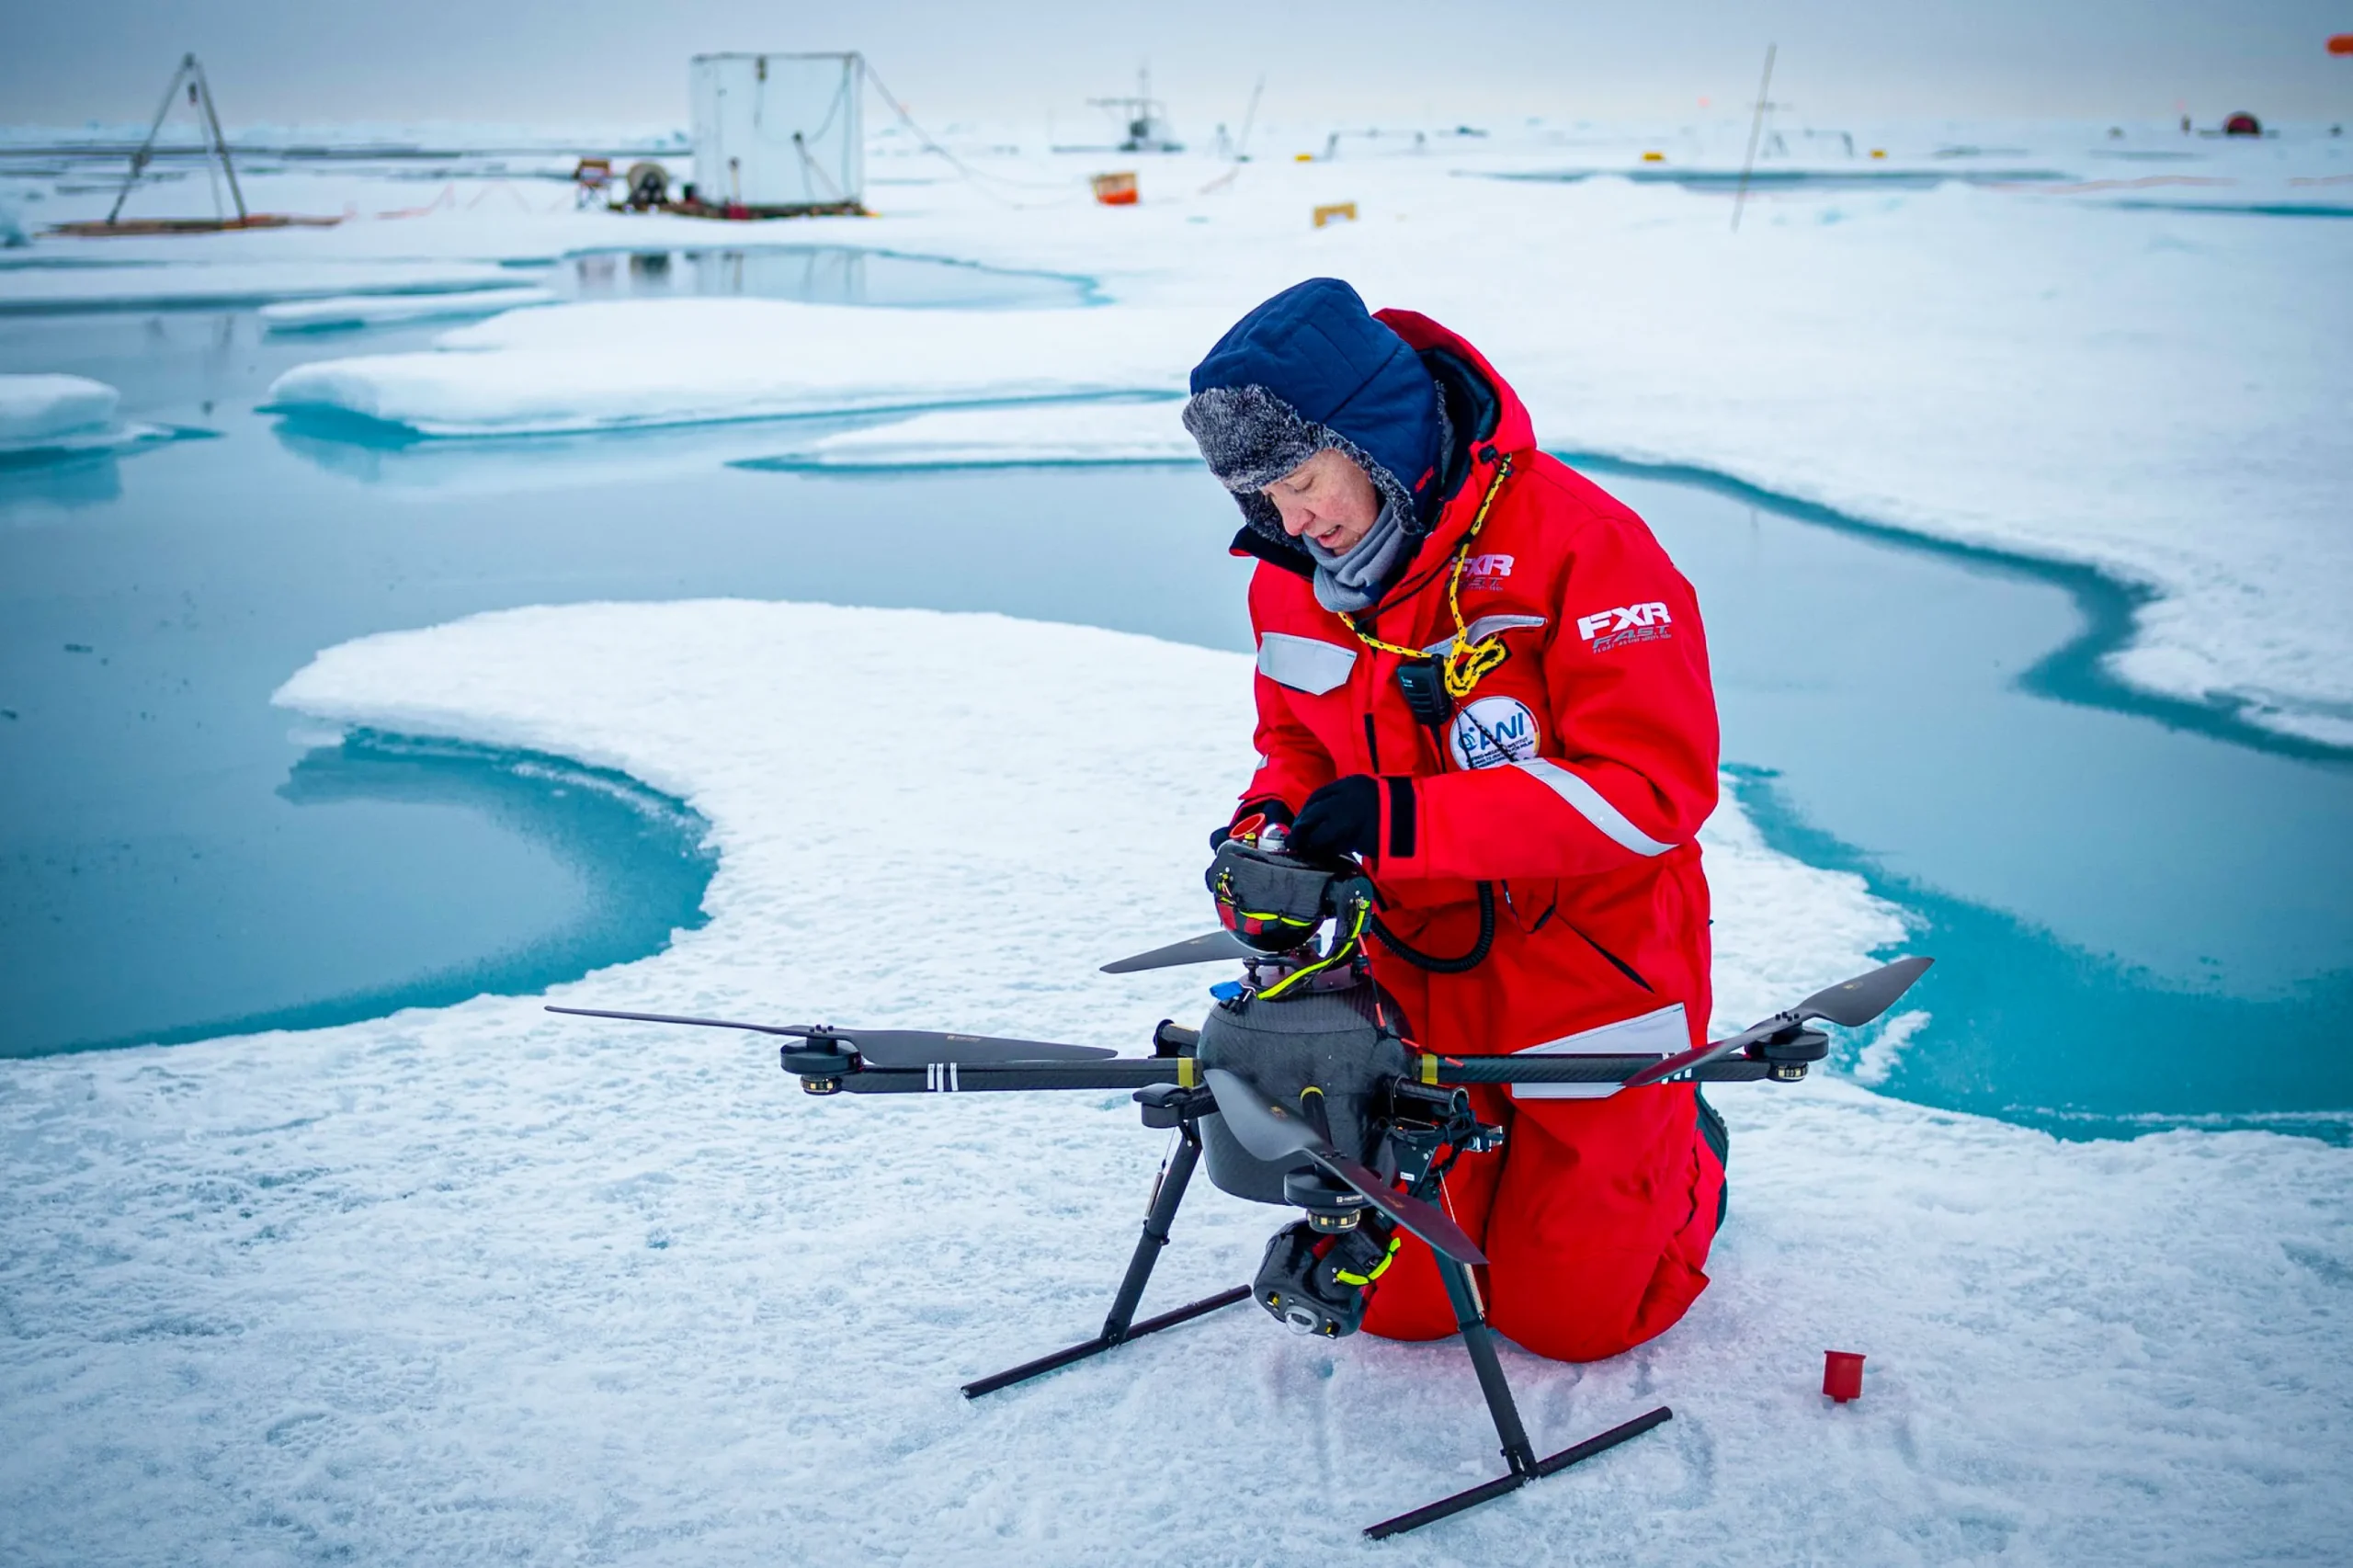
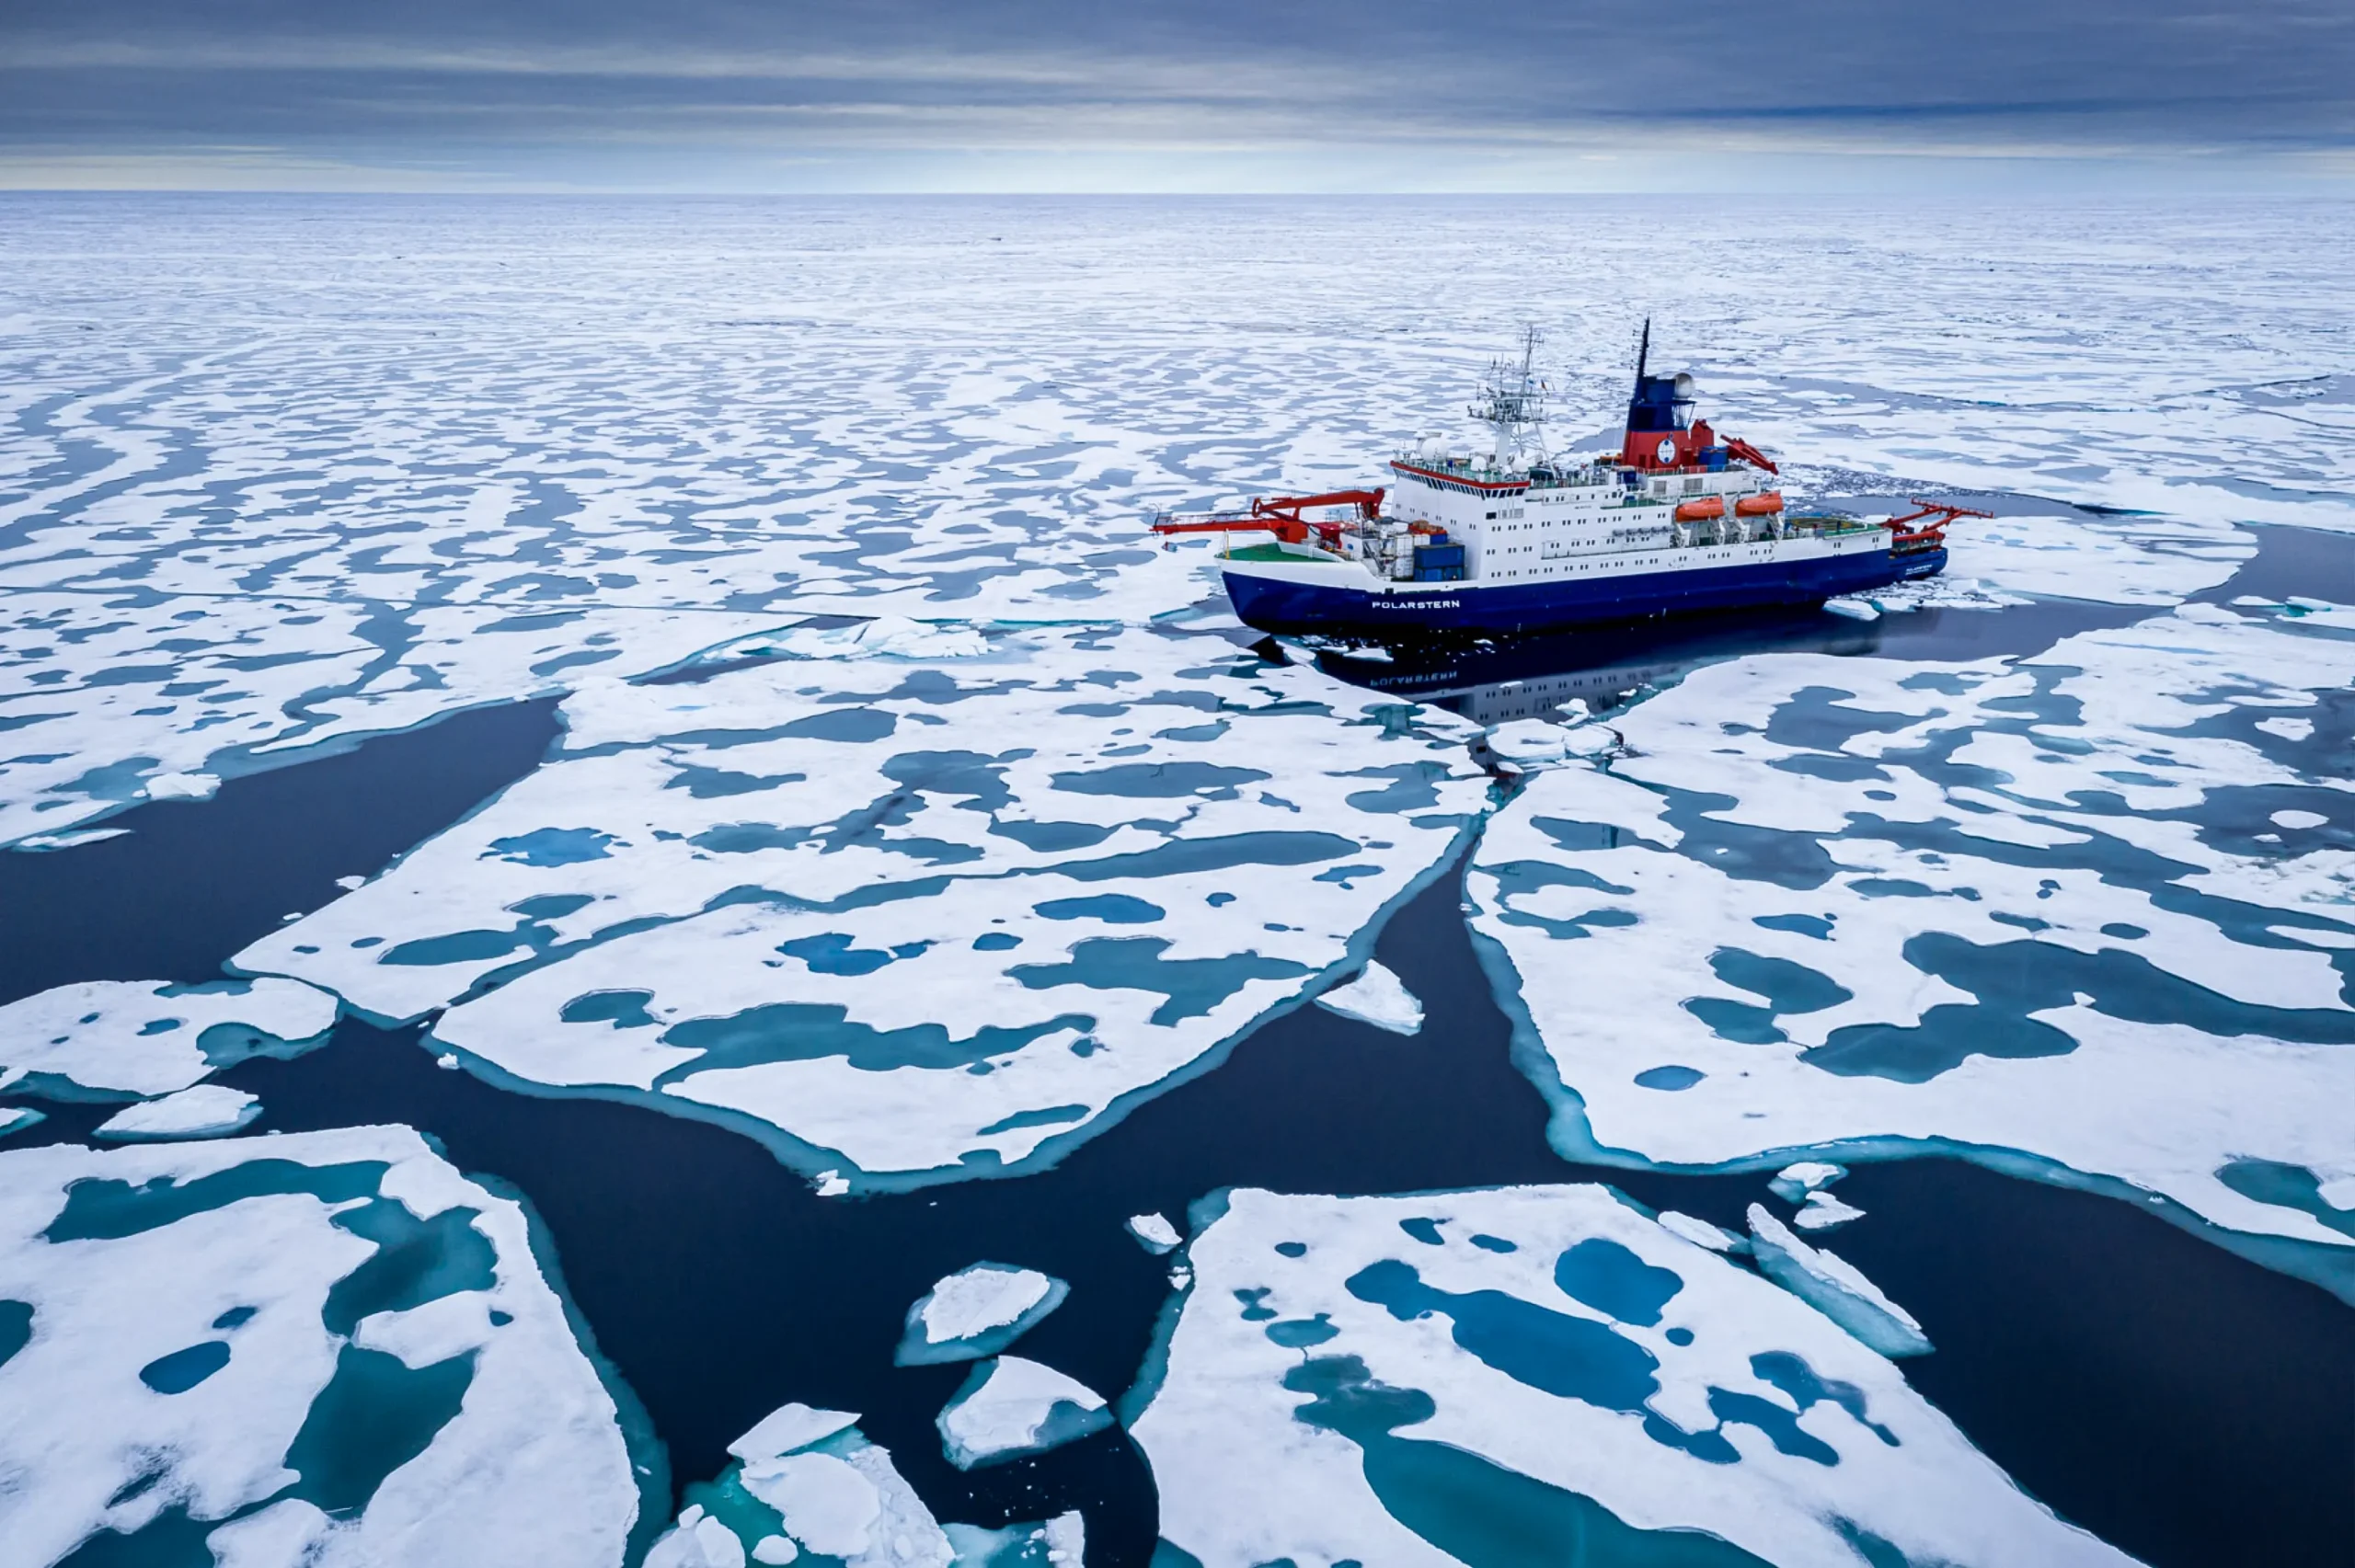
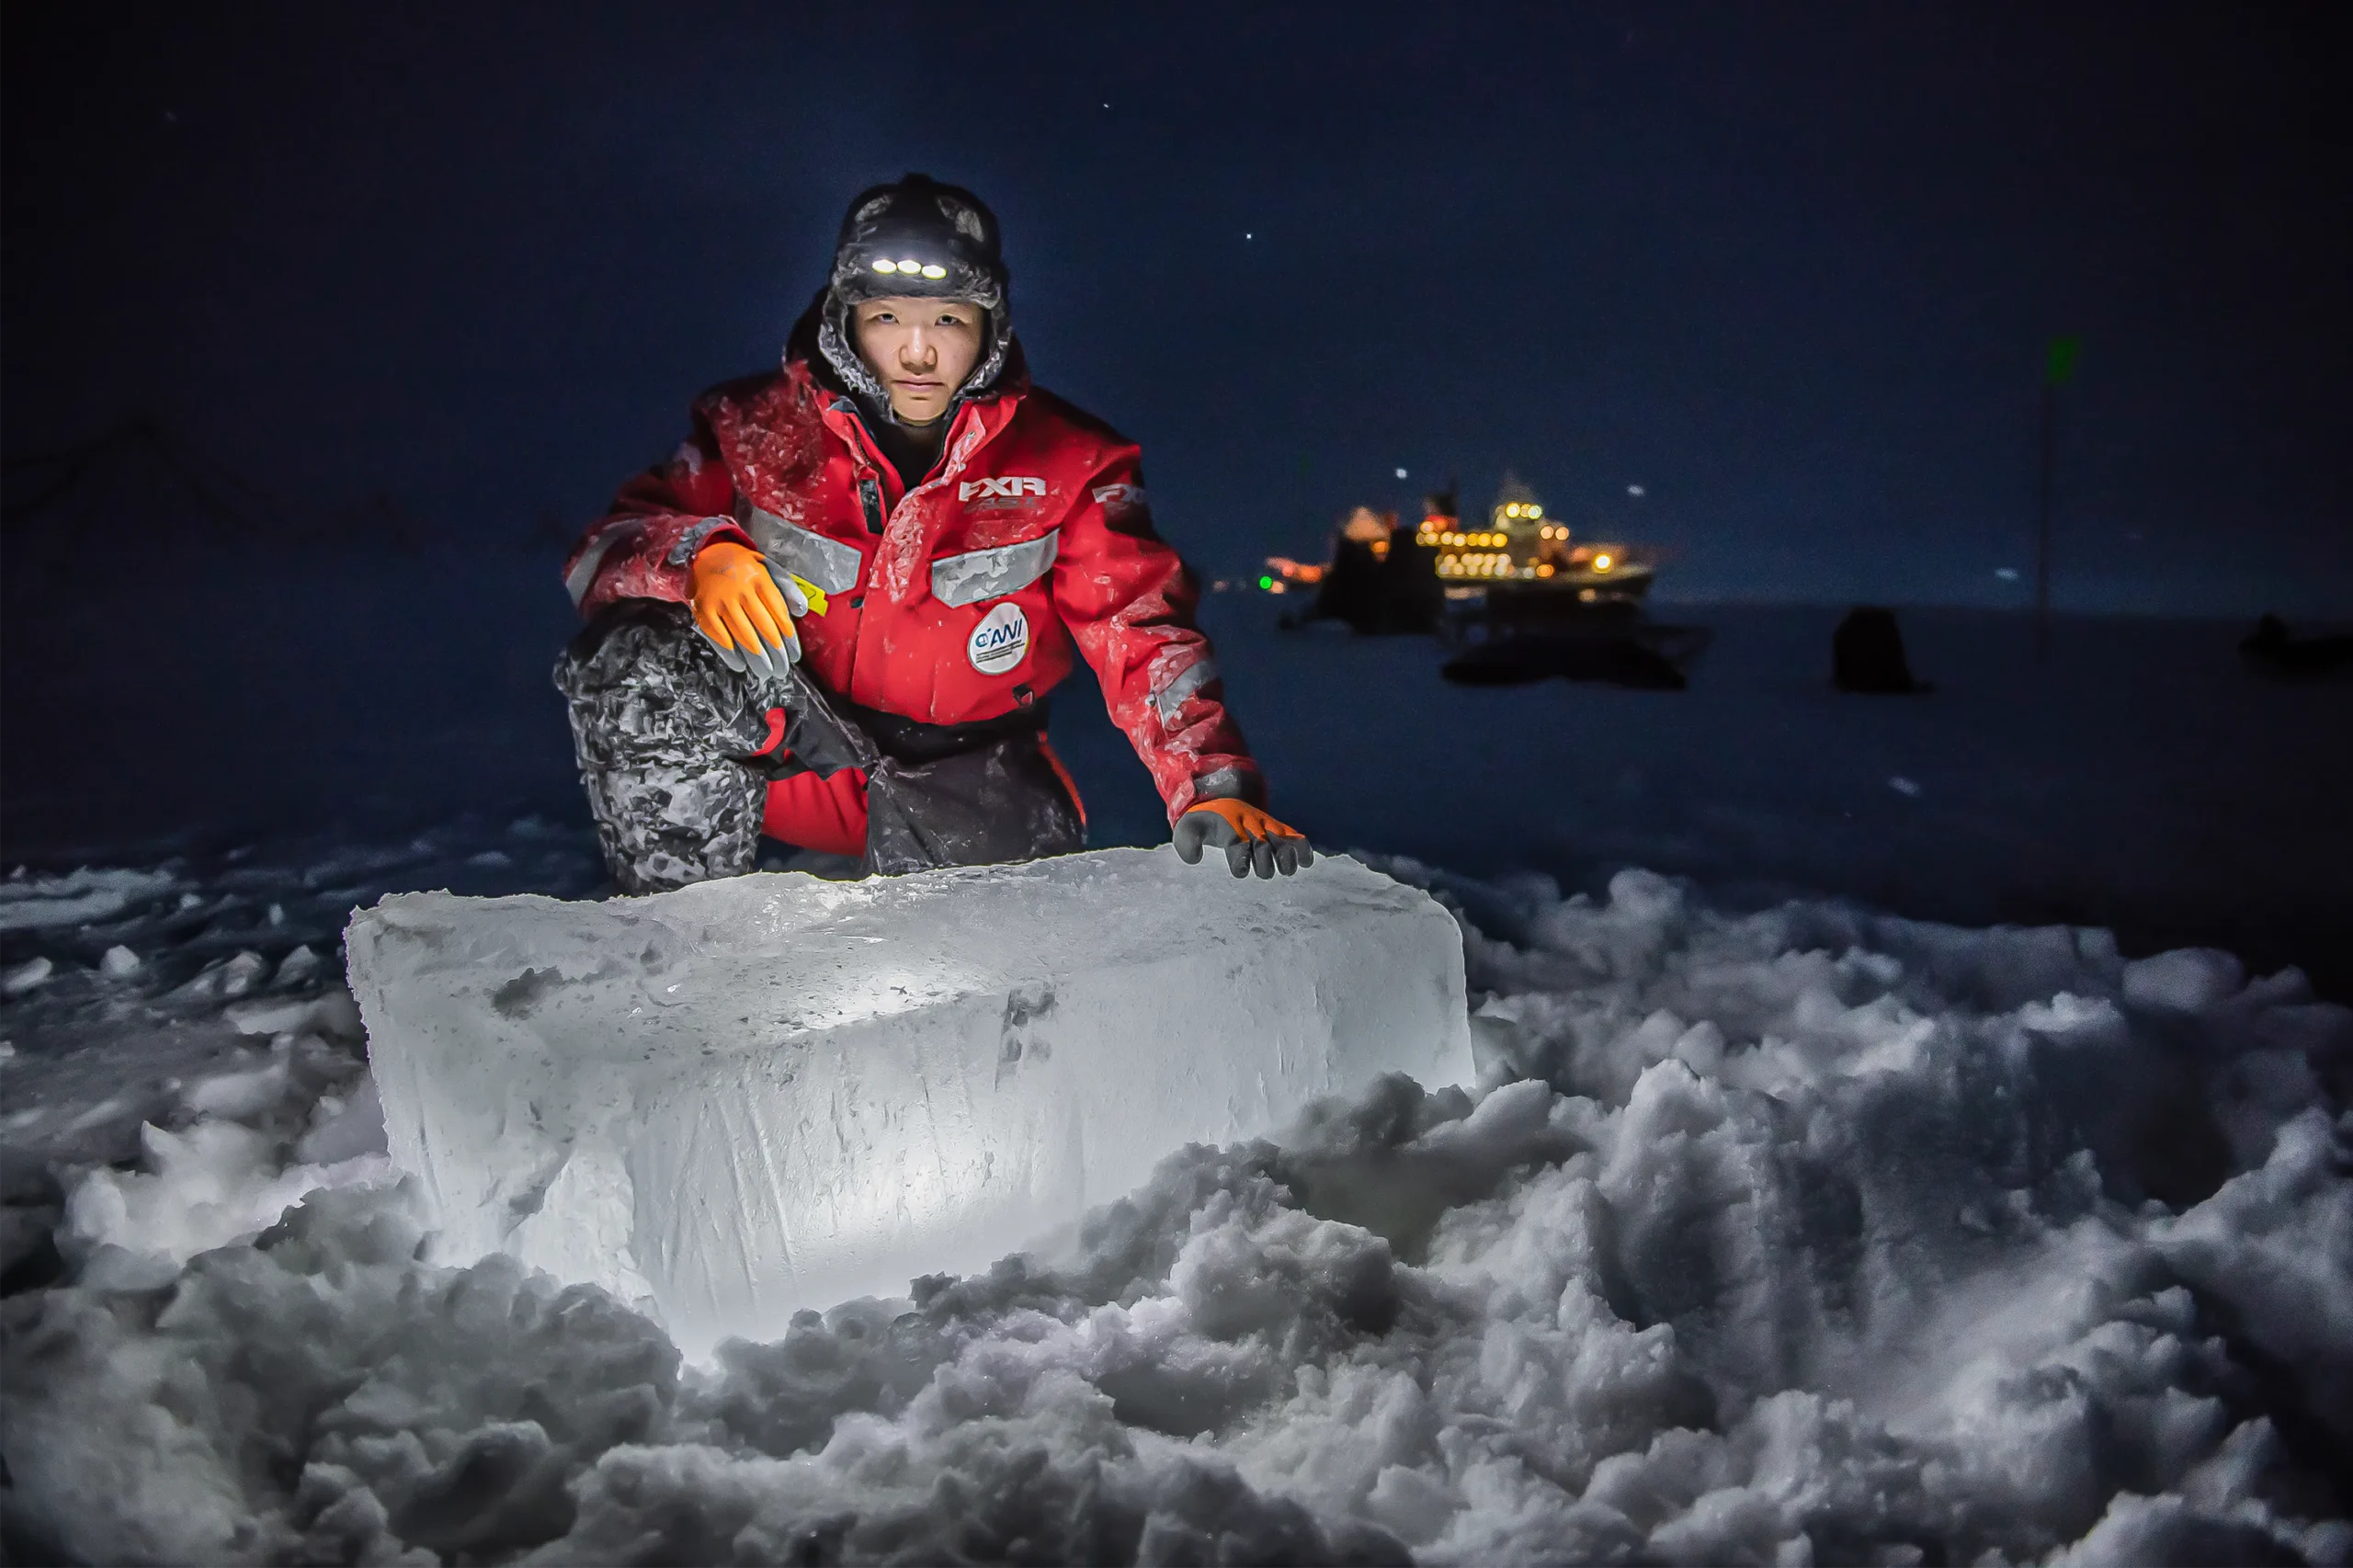
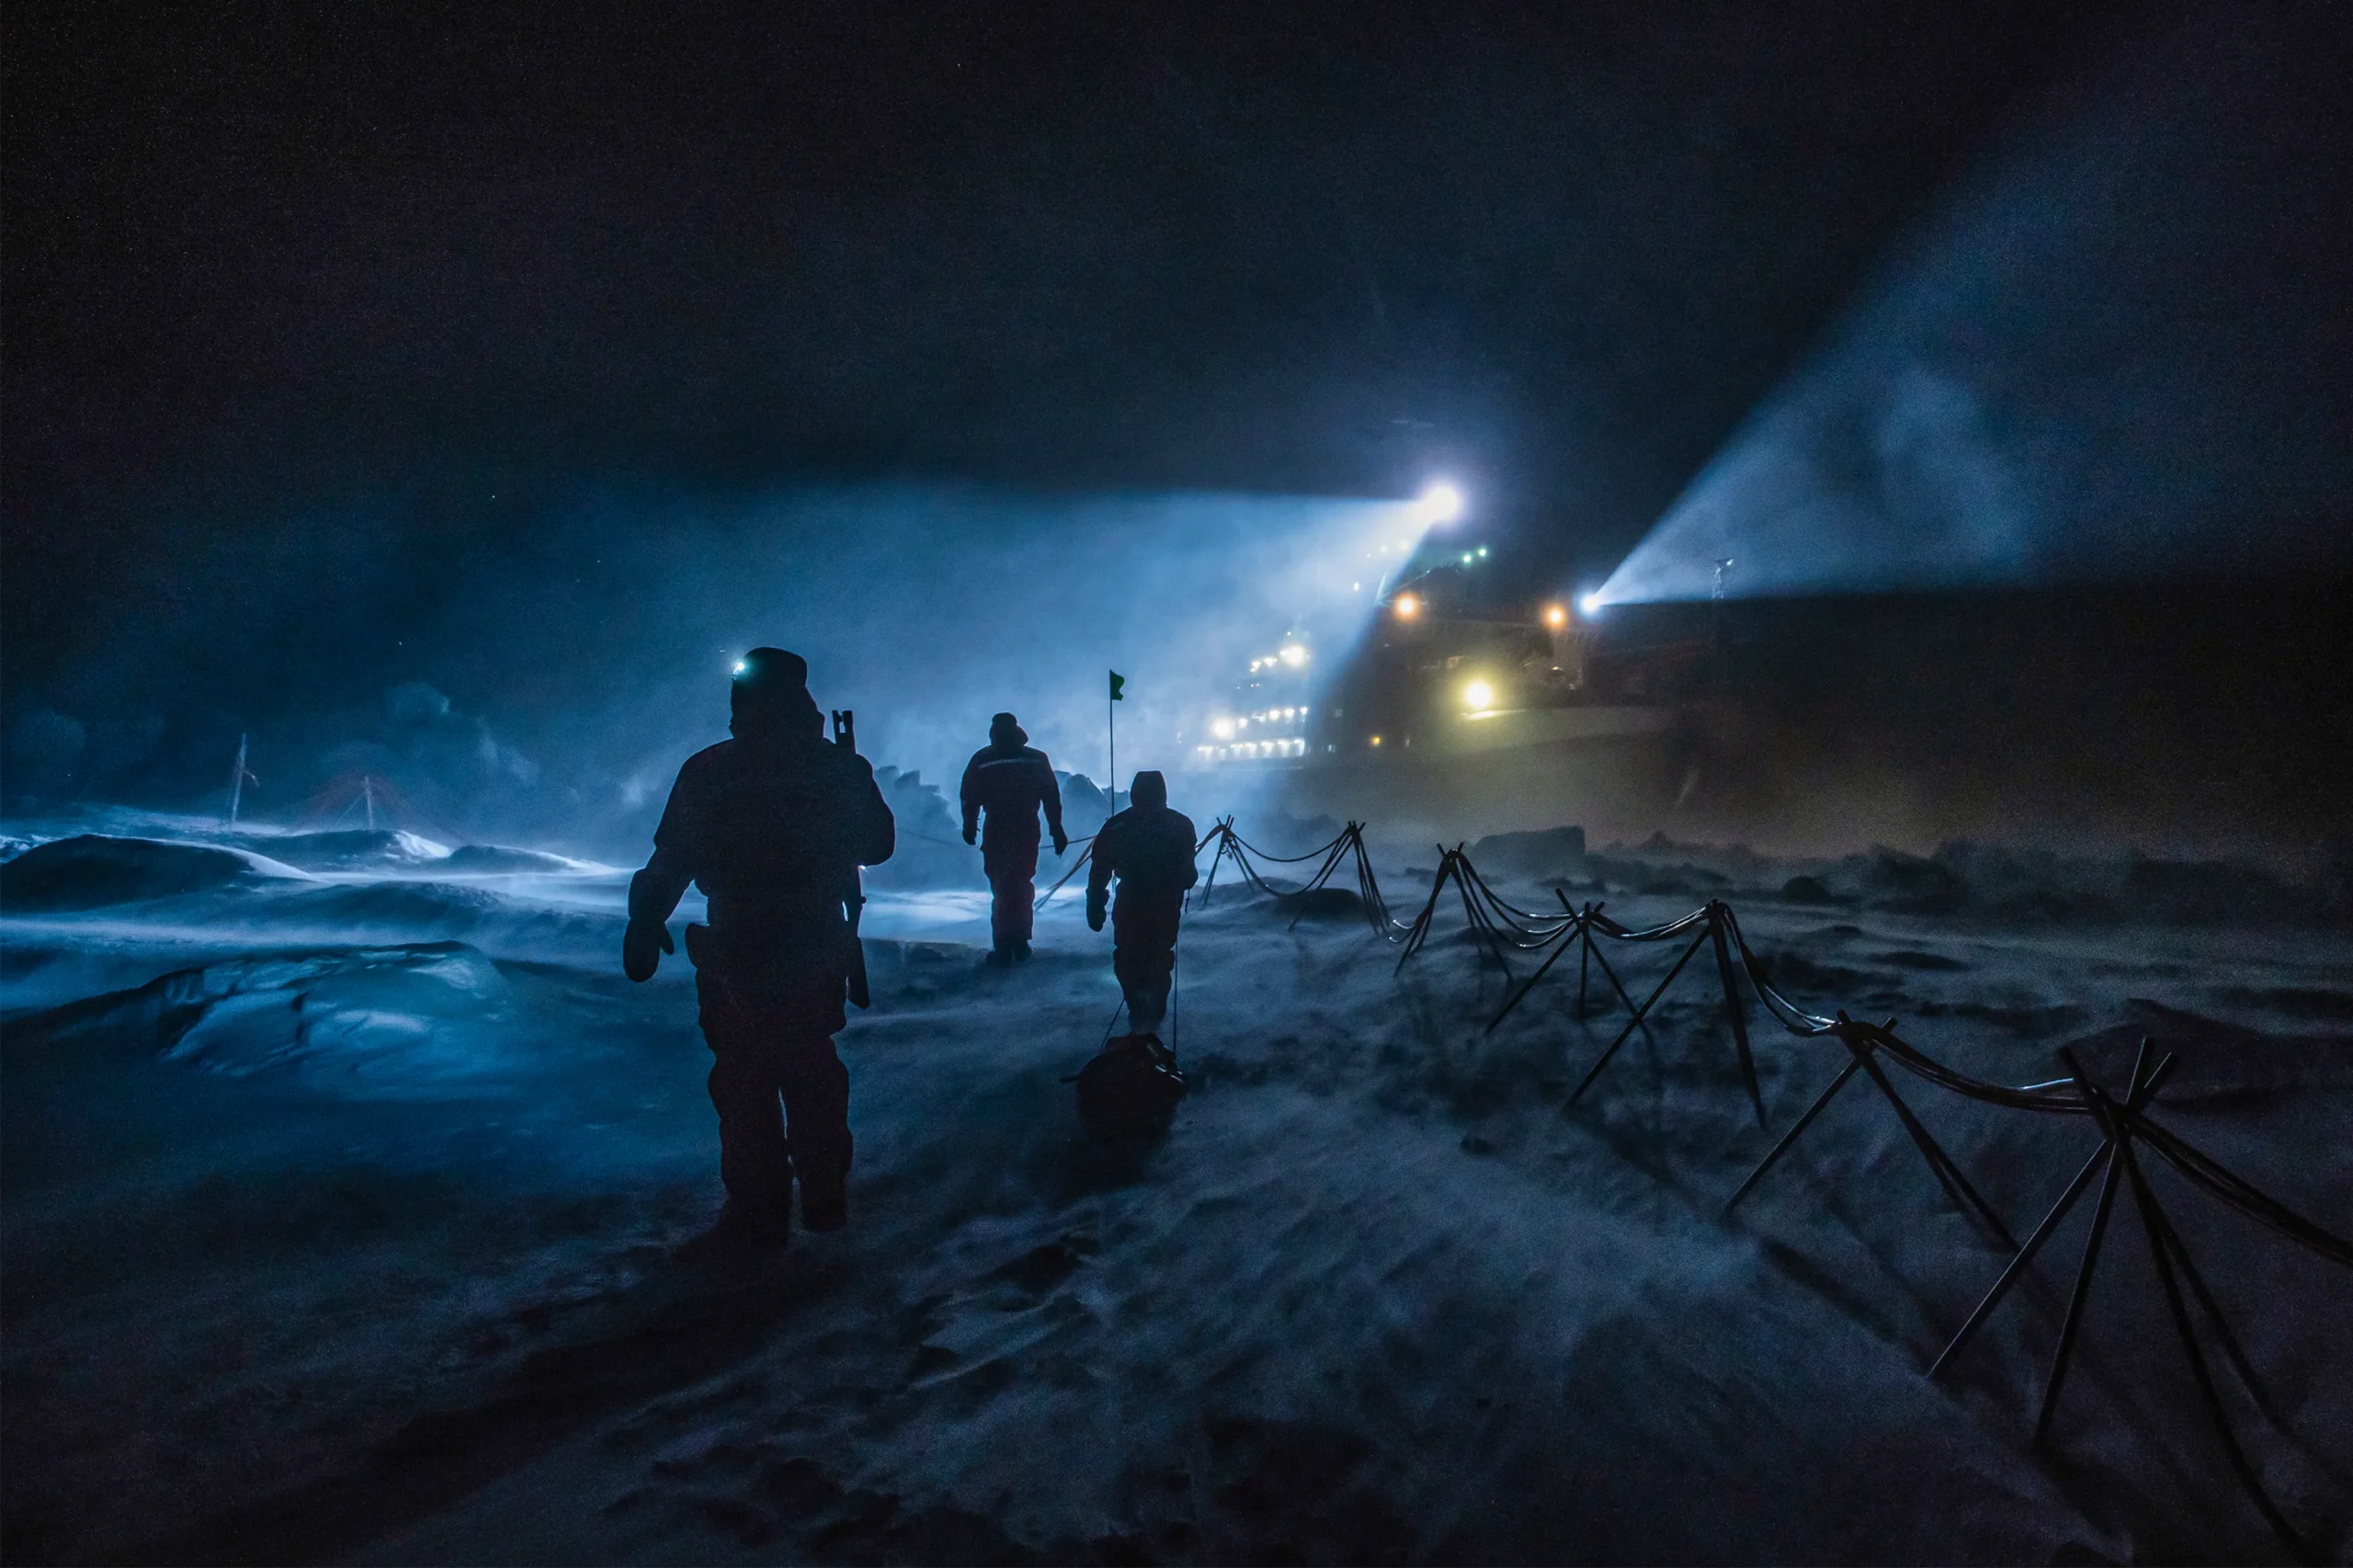
To “go with the flow” of drifting ice and currents, Nicolaus said, researchers lodged their ship, the RV Polarstern, in a floe and stayed with it for 300 days until the ice cracked apart. First, “we had to build our little Mosaic city,” he said — a series of encampments on the ice beyond the ship that let physicists, biologists, oceanographers and others take measurements safely and consistently. It took about a week to construct the Mosaic city, but the work to maintain it never ended. The ice was constantly shifting, building new pressure ridges and destroying parts of instruments and sites. “We had so much ice dynamics,” he said. “It was always something in transition, continuously changing.”
Whether the researchers were stabilizing their little city or taking measurements, the cold, dark days could be rough. But for the most part spirits stayed high. “There’s a type of person that likes to do these things,” Nicolaus said on a video call from RV Polarstern while on a different Arctic expedition (with impressive Wi-Fi). “In the end, there’s one out of 50 [researchers] that would say, ‘OK, I’ve been here; I don’t need to do that again.’ But the other 49, they catch the Arctic virus and they want to come back.”