The Math That Explains Why Bell Curves Are Everywhere

The central limit theorem is what makes bell-shaped distributions so ubiquitous.
Irene Pérez for Quanta Magazine
Introduction
No matter where you look, a bell curve is close by.
Place a measuring cup in your backyard every time it rains and note the height of the water when it stops: Your data will conform to a bell curve. Record 100 people’s guesses at the number of jelly beans in a jar, and they’ll follow a bell curve. Measure enough women’s heights, men’s weights, SAT scores, marathon times — you’ll always get the same smooth, rounded hump that tapers at the edges.
Why does the bell curve pop up in so many datasets?
The answer boils down to the central limit theorem, a mathematical truth so powerful that it often strikes newcomers as impossible, like a magic trick of nature. “The central limit theorem is pretty amazing because it is so unintuitive and surprising,” said Daniela Witten, a biostatistician at the University of Washington. Through it, the most random, unimaginable chaos can lead to striking predictability.
It’s now a pillar on which much of modern empirical science rests. Almost every time a scientist uses measurements to infer something about the world, the central limit theorem is buried somewhere in the methods. Without it, it would be hard for science to say anything, with any confidence, about anything.
“I don’t think the field of statistics would exist without the central limit theorem,” said Larry Wasserman, a statistician at Carnegie Mellon University. “It’s everything.”
Purity From Vice
Perhaps it shouldn’t come as a surprise that the push to find regularity in randomness came from the study of gambling.
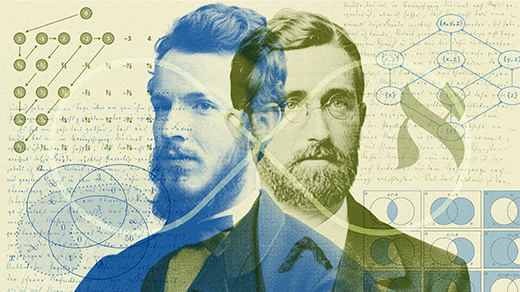
In the coffeehouses of early-18th-century London, Abraham de Moivre’s mathematical talents were obvious. Many of his contemporaries, including Isaac Newton and Edmond Halley, recognized his brilliance. De Moivre was a fellow of the Royal Society, but he was also a refugee, a Frenchman who had fled his home country as a young man in the face of anti-Protestant persecution. As a foreigner, he couldn’t secure the kind of steady academic post that would befit his talent. So to help pay his bills, he became a consultant to gamblers who sought a mathematical edge.
Flipping a coin, rolling a die, and drawing a card from a deck are random actions, with every outcome equally likely. What de Moivre realized is that when you combine many random actions, the result follows a reliable pattern.
Flip a coin 100 times and count how often it comes up heads. It’ll be somewhere around 50, but not very precisely. Play this game 10 times, and you may get 10 different counts.
Now imagine playing the game 1 million times. The bulk of the outcomes will be close to 50. You’ll almost never get under 10 heads or over 90. If you make a graph of how many times you see each number between zero and 100, you’ll see that classic bell shape, with 50 at the center. The more times you play the game, the smoother and clearer the bell will become.
De Moivre figured out the exact shape of this bell, which came to be called the normal distribution. It told him, without his having to actually play the game, how likely different outcomes were. For instance, the probability of getting between 45 and 55 heads is about 68%.
De Moivre marveled with religious devotion at the “steadfast order of the universe” that eventually overcame any and all deviations from the bell. “In process of time,” he wrote, “these irregularities will bear no proportion to the recurrency of that order which naturally results from original design.”
He used these insights to sustain a meager life in London, writing a book called The Doctrine of Chances that became a gambler’s bible, and holding informal office hours at the famed Old Slaughter’s Coffee House. But even de Moivre didn’t realize the full scope of his discovery. Only when Pierre-Simon Laplace ran with the idea in 1810, decades after de Moivre’s death, was its full reach uncovered.
Let’s take an example slightly more complex than coin flips: dice rolls. Every roll of a die has six equally likely outcomes. If you repeatedly roll the die and tally the results, you’ll get a chart that looks flat — you’re bound to see about as many rolls of 1 as you do 2 or 4 or 6.
Now roll that die 10 times and take the average. You’re likely to get somewhere around 3.5. Repeat the experiment many more times and graph up all the results. You’ll get a bell curve that peaks at 3.5, with a precisely defined structure on either side.
That’s the magic of the central limit theorem. You started with a distribution of possible outcomes that has no structure at all — equal chances of rolling 1 through 6. But by taking an average of multiple measurements, then repeating that process over and over, you get a precise, predictable, mathematical structure: the bell curve.
Laplace distilled this structure into a simple formula, the one that would later be known as the central limit theorem. No matter how irregular a random process is, even if it’s impossible to model, the average of many outcomes has the distribution that it describes. “It’s really powerful, because it means we don’t need to actually care what is the distribution of the things that got averaged,” Witten said. “All that matters is that the average itself is going to follow a normal distribution.”
An Omnipresent Tool
Averaging might seem like something it takes a human to do, but the central limit theorem applies invisibly to all kinds of things we can observe in the world, like human heights. “Somebody’s height might depend on their dad’s height, and their mom’s height, and their genetics, and their nutrition, and all these little effects that add up,” said Jeffrey Rosenthal, a statistician at the University of Toronto. Those effects are unrelated to each other (generally, your dad’s height has nothing to do with the food you eat). “It’s kind of like averaging a bunch of little effects,” said Rosenthal, which is why height approximately follows a normal distribution.
This is why all kinds of datasets seem to conform to this beautiful shape spontaneously. “Anywhere that there’s an average under the hood, if it’s an average over enough things, then you’re going to end up with a normal distribution,” Witten said.
The theorem also gives statisticians the power to tell when something fishy is happening. Say you’re sipping coffee at Old Slaughter’s when a patron hands you a coin and bets that you can’t get 45 heads in 100 flips. You try, and only get 20. How can you tell whether he gave you a trick coin and the process is not as random as it ought to be? Thanks to the central limit theorem, you know that the numbers up to 20 only cover 0.15% of the bell, so there’s only a 0.15% chance a fair coin would give such a bad result. You’re almost certainly being had.
That’s the true power of Laplace’s formula. He knew that averaging over any process gives you a bell curve, which lets you say something about that process, without knowing anything deeper about how it works.
Handle With Care
Despite its centrality to modern science, the central limit theorem has limits of its own. It only works when you’re combining many samples, and those samples need to be independent. If they’re not — for example, if you only run a national presidential poll in a single small town in Maine — repeating the experiment won’t get you closer to the expected bell curve.
And sometimes in science, the outliers can be more important than the average. “The ‘hundred-year flood’ is suddenly happening more often,” said Richard D. De Veaux, an applied statistician at Williams College. “These days, modeling extreme events is probably as important as modeling the mean.”
Fortunately, the idea behind the central limit theorem — the power and reliability of averages — has been used far and wide to extend the power of statistics. Statisticians often formulate a version of the central limit theorem for whatever specific problem they’re working on. “There’s so many more complicated things where if you’re clever you can write it as a sample mean plus some error,” Wasserman said. In those cases, you can use a variant of the theorem to simplify the problem.
The central limit theorem is a pillar of modern science, ultimately, because it’s a pillar of the world around us. When we combine lots of independent measurements, we get clusters. And if we’re clever enough, we can use those clusters to find out something interesting about the processes that made them.