‘Stunning’ Percolation Proof Solves Decades-Old Puzzle About Phase Transitions
Introduction
The week before Christmas 2025, five mathematicians were holed up in a classroom at ETH Zurich. The mood was electric: They were this close to a career-defining breakthrough.
The group — consisting of then-postdocs Sahar Diskin and Philip Easo, graduate student Ritvik Ramanan Radhakrishnan, Benny Sudakov, and Vincent Tassion — was perfecting a solution to one of the biggest open problems in percolation theory, the study of flow in a network.
Percolation captures a vast array of phenomena, but the prototypical examples involve fluids, like hot water seeping through a bed of coffee grounds. Diskin, Easo, Radhakrishnan, Sudakov, and Tassion were trying to work out something fundamental about how graphs — networks of points connected by lines, or edges — can be taken over by large connected areas, the equivalent of pools of fluid. The group had glimpsed a simple argument that could deal with a huge variety of graphs at once.
“We almost didn’t believe it at first,” Radhakrishnan said.
They raced to confirm each detail, eager to get their idea down before it shimmered away — and heedless of the holiday. “I’m not sure the girlfriends and the families were as happy as we were. But we were all very happy at that moment,” Diskin said. “It’s really rare that you’re able to hit something that feels so big and so meaningful.”
They worked through the night. By the morning of December 17, exhilarated from the effort, they were convinced their idea was correct. By Christmas, they’d nailed down a proof.
They had answered a decades-old question about how fast a percolation network floods as you open it up to fluid flow. “I find great joy in this proof,” said Asaf Nachmias of Tel Aviv University, who studies percolation theory and probability. “It’s stunning.”
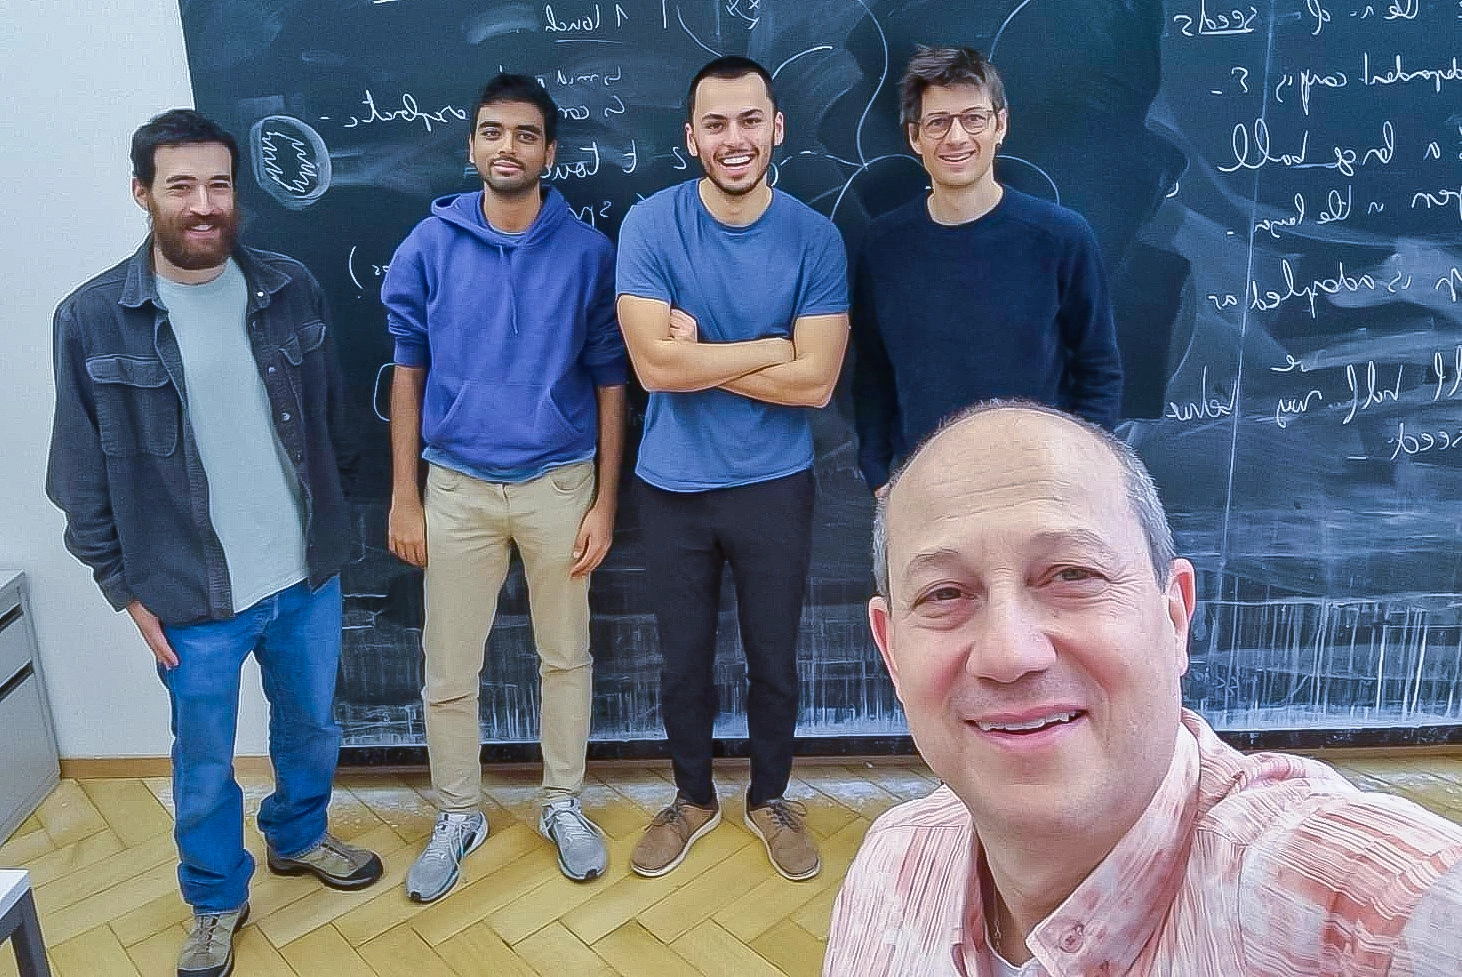
From left: Sahar Diskin, Ritvik Ramanan Radhakrishnan, Philip Easo, Vincent Tassion, and Benny Sudakov take a group selfie after completing their paper on supercritical sharpness.
Benjamin Sudakov
Franklin’s Fluids
Percolation can describe many kinds of flow: the spread of a virus through a city, gas passing through a filter, or the propagation of a wildfire. But its original inspiration was coal.
In the 1940s, the scientist Rosalind Franklin — now famous for her work on the structure of DNA — was employed at the British Coal Utilization Research Association (BCURA), trying to understand the intricate properties of coal, charcoals, and graphite. Scientists knew that coal was studded with tiny holes, but they didn’t know why some types of coal allowed fluids to pass through them, while others were impermeable.
By submerging coal in a variety of fluids, Franklin was able to measure the typical size of its holes, as well as the amount of variation. About a decade later, the researchers Simon Broadbent and John Hammersley — wanting to understand the carbon filters in gas masks — developed a mathematical model.
Their idea was simple. Take a grid of evenly spaced points (also called a lattice) and a coin. For each pair of neighboring points, flip the coin. If it lands on heads, connect the points with an edge. Fluid can flow between these points. If the coin lands on tails, the flow is blocked. Repeat this procedure for every pair of points. How far does the fluid go?


Mark Belan/Quanta Magazine
The answer depends on the probability that your coin lands on heads, which can range from 0% to 100%. When the probability is low, fluid can flow through only a few channels, and so it collects in small, isolated puddles.
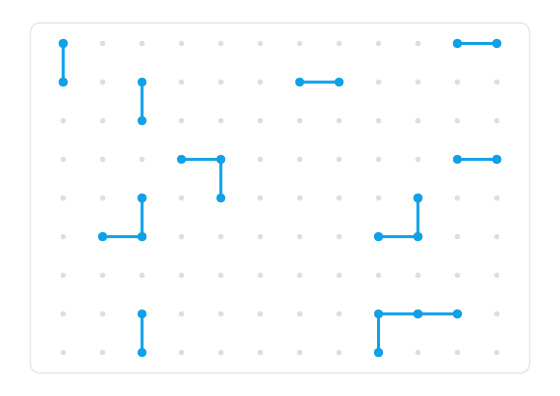
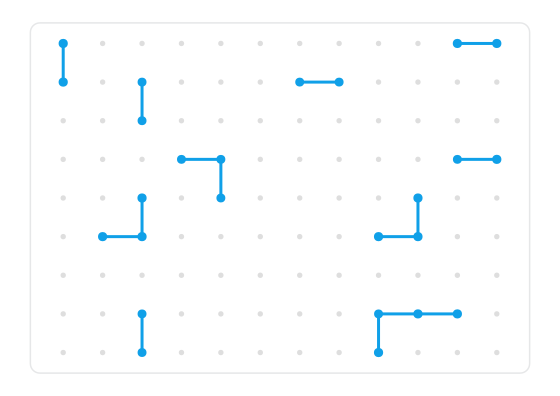
But once the probability passes a threshold called the critical probability, the lattice suddenly opens up. Fluid can travel extensively through the system.
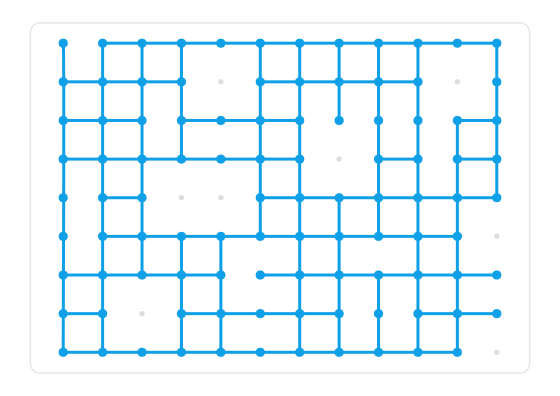
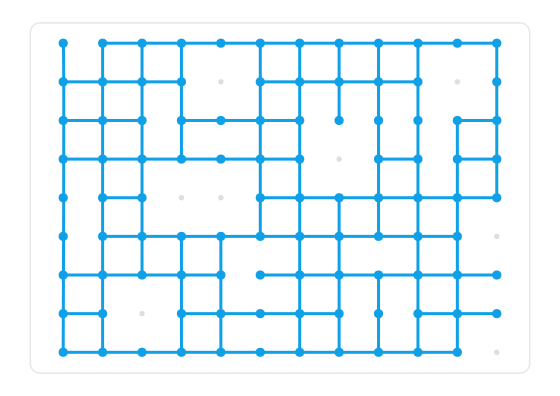
The exact value of the critical probability changes depending on the shape of the lattice — a square lattice has a different critical probability than a triangular one, and a 3D lattice has a different critical probability than a 2D one. But as you move above that critical value, you’ll see a phase transition, like liquid water turning to ice. On a finite graph, crossing the critical probability means the network will become dominated by one large sea of fluid. On an infinite graph — an abstraction where the graph extends forever in all directions — one or several infinite seas will dominate. Physicists quickly realized that through percolation, they could learn about melting and freezing, as well as other phase transitions like magnetization.
“Phase transitions in physics are very hard to study rigorously,” Easo said. “Percolation is like the caricature. So people often try to study that first, and then tools trickle down.”
For scientists who had long been stymied by complicated real-world phase transitions, “it was catching the essence in a very simple setup,” said Itai Benjamini of the Weizmann Institute for Science. “A lot of things that could cloud the issue were removed.”
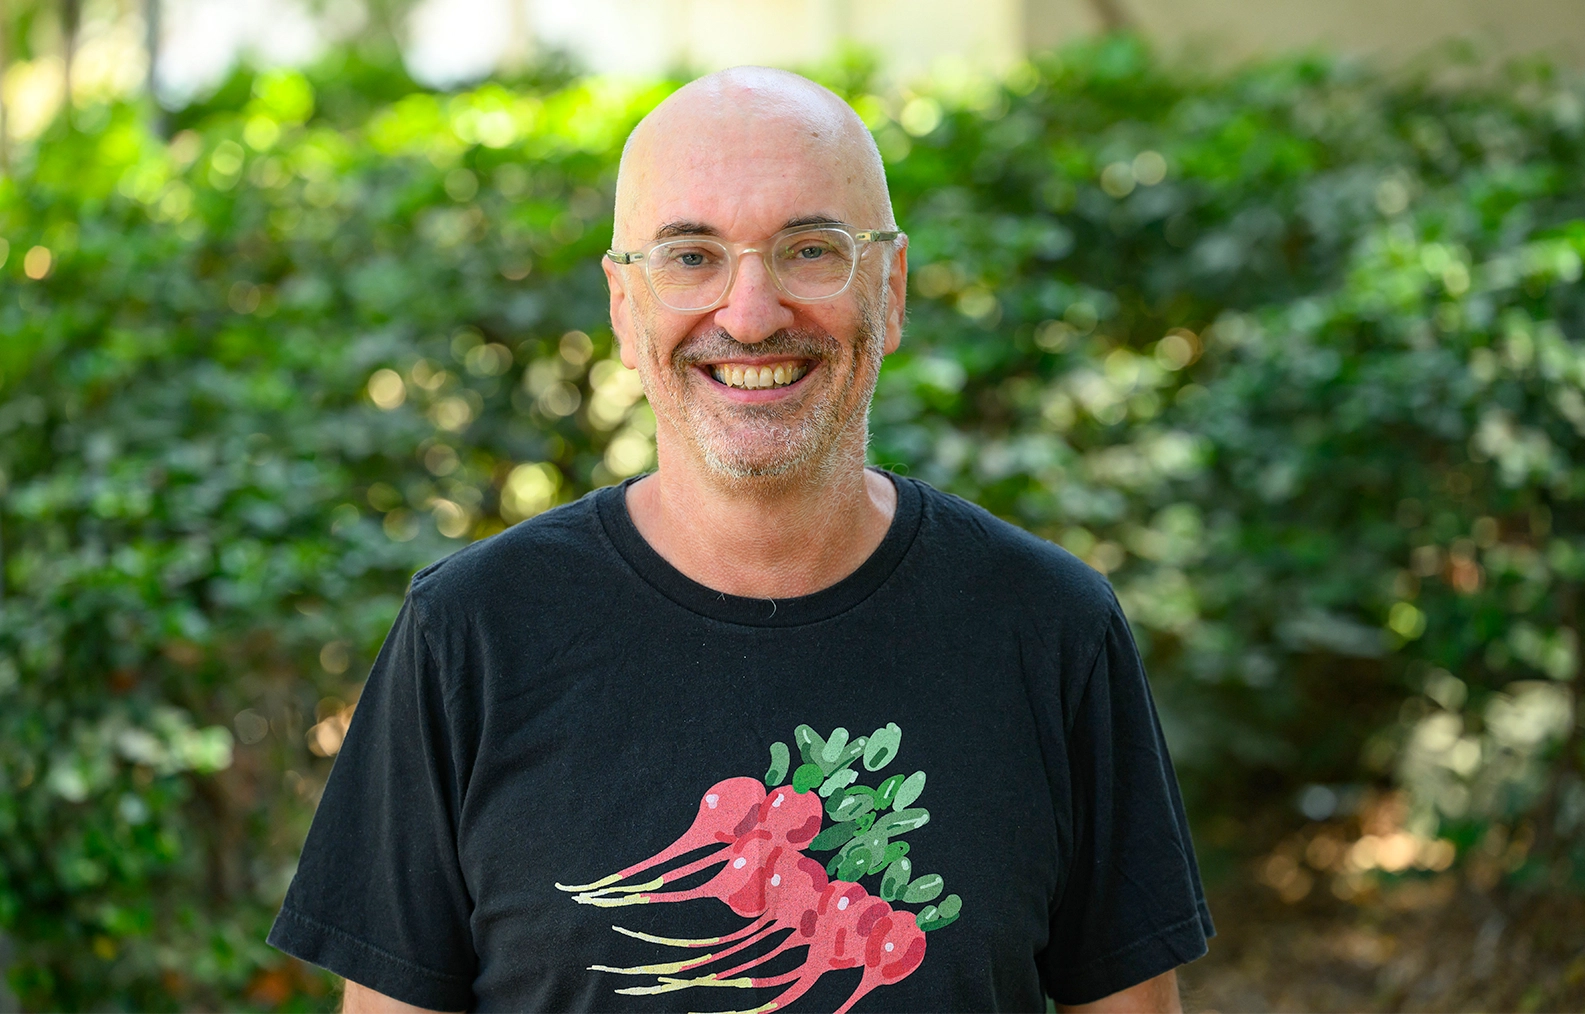
Itai Benjamini, along with his collaborator Oded Schramm, made early progress studying the percolation of transitive graphs.
Courtesy of Itai Benjamini
For decades, researchers worked to quantify the percolation phase transition. They wanted to know exactly how quickly pools of fluid can grow as you increase the probability that your coin lands on heads. Many predicted that the pools grow very fast — that below the critical probability, puddles are tiny, and above it, a single ocean covers almost everything. This prediction is called the sharpness conjecture.
When sharpness was proved on lattices in the 1980s — by two independent groups, one in New Jersey and one in Moscow — it was “foundational,” said Tom Hutchcroft of Princeton University and the California Institute of Technology, who was Easo’s doctoral adviser. Knowing sharpness, mathematicians can deduce a lot about the structure of the flooded portion of the network — in particular, that it looks very similar to the underlying lattice.
So when Benjamini and his colleague Oded Schramm plotted an expedition to bring percolation to new types of networks, it seemed natural to wonder if sharpness would go with them.
Off the Grid
In 1996, Benjamini and Schramm wanted to study percolation in a much larger class of graphs, called transitive graphs. To understand what a transitive graph is, imagine the graph as a network of roads on a flat, desolate landscape. If you want to know where you are on these roads, the only landmarks are the intersections. But if the graph is transitive, all the intersections look similar — to figure out where you are, you’ll need GPS or a compass.
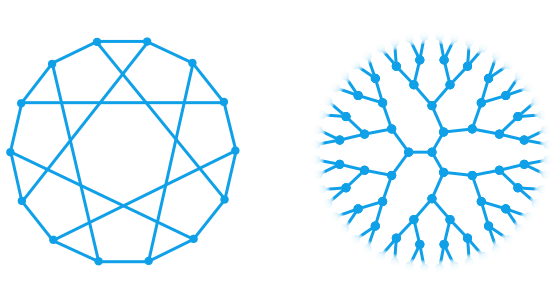
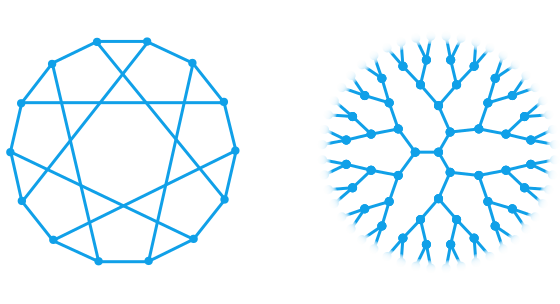
A square lattice is one example of a transitive graph: Every intersection consists of four edges meeting at right angles. But there are many kinds of transitive graphs — simple loops (below left) and infinitely expanding “trees” (below right), as well as ones that are almost impossible to visualize.
Many transitive graphs represent objects from other mathematical subfields, like algebra or geometry. Benjamini was intrigued by these interdisciplinary possibilities — he hoped the percolation process would reveal insights into the graph itself. “You have a stage, which is geometry, and a dancer, which is the random process,” he said. By watching the dancer, he hoped to learn more about the stage.
Over the next decade, Benjamini, Schramm, and their colleagues published a flurry of results on the percolation of transitive graphs. They proved that, for a class of infinite transitive graphs, percolation exhibits a phase transition as you open up edges to flow: Small, isolated pools of fluid suddenly coalesce into an infinite web of connected rivers.
But they still didn’t know how fast that transition happened. Below the critical point, how big and how numerous were the pools? Above it, was the infinite web a meadow crisscrossed with streams — or was it more like an ocean, swamping the entire graph?
Benjamini and Schramm suspected that a version of the sharpness conjecture was true on all infinite transitive graphs. That conjecture could be broken down into two separate problems. The “subcritical” half — addressing what happens below the critical point — was completed in 2007, by Tonći Antunović and Ivan Veselić. Their work showed that here, pools of fluid are tiny and far apart. Even a hair below the critical point, the system looks more like Arizona than Minnesota.
The “supercritical” half of the conjecture — which deals with probabilities above the critical threshold — seemed harder. Here, the landscape should be made up of possibly many seas, each infinitely large. In this scenario, large pools that are not connected to the infinite seas become exceedingly rare. That’s because a large, isolated pool can only stay separate if there is a lot of dry land — or closed edges — around it.
But a proof of supercritical sharpness seemed unattainable. For one thing, the previous work was no help: A proof of supercritical sharpness on lattices was long and complicated, and it couldn’t be adapted to the more general case. While other foundational results were simplified in the last decade, “this was the one remaining fortress,” Nachmias said.
Mathematicians working on this problem “did some very beautiful things, initiated the theory, picked all the low-hanging fruit,” Benjamini said. “And then we started hitting the wall.”
In 2008, as progress on non-lattice percolation slowed, Schramm died at age 46 in a fall while hiking. “We lost a genius, Oded Schramm, to a tragic accident,” Benjamini said. “And then we needed to wait for some new geniuses to come.”
About a decade ago, the field began to accelerate again. But proving supercritical sharpness remained difficult.
Then, the team in Zurich produced a simple proof.
A Sharp Turn
Diskin, Easo, Radhakrishnan, Sudakov, and Tassion didn’t intend to prove supercritical sharpness. For most of fall 2025, they were trying to understand how critical probability scales with the number of edges in graphs.
But the five mathematicians wanted results by the end of the semester. As that deadline neared, they still had nothing resembling a proof. So Easo suggested pivoting to sharpness. He, Diskin, and Radhakrishnan made some progress and brought their results to Sudakov and Tassion. As Tassion took in their work, an idea — perhaps an outrageous one — formed in his mind.
He thought that, with some tweaks, their strategy might be strong enough to prove sharpness for all infinite transitive graphs. “From there, it was in my head day and night,” Tassion said.
“Vincent went crazy with it,” Diskin said. “I think he didn’t sleep for two weeks at least.”
It wasn’t only Tassion. Over those weeks, the collaboration became frenzied. The mathematicians traded ideas constantly, often texting late at night. “We really all had this hunch that there might be something to it,” Diskin said. “We were half joking at the beginning … maybe the same idea could resolve this huge conjecture. We were all laughing at each other, but what if, what if?”
Radical Simplicity
Brimming with excitement, and with the holidays looming, they decided it was time to get serious and write their paper.
To prove that a large isolated pool of fluid is unlikely above the critical probability, the mathematicians assumed they had such a pool and studied the surrounding shoreline. Along that shoreline, there were streams emptying into the pool, but there were also streams that linked back to one of the infinite seas. If those streams coincided anywhere, the mathematicians would have a contradiction — their so-called finite pool of fluid would actually be part of an infinite sea.
If the pool was big, the shoreline was long — meaning a larger area where the pool might connect to one of the infinite seas. The fivesome showed that this made it nearly impossible to avoid the contradiction.
As they hammered out the last details of their paper, they suddenly saw that with a simple change, their argument could be drastically improved.
They had been using a common technique in probability theory called sprinkling: They set aside a few of their open edges, corresponding to a slight lowering of the critical probability. They then looked for a large pool among the rest of the edges and analyzed the open paths around it. Since the set-aside edges had nothing to do with the pool, they could be analyzed independently. That made it easier to prove that, once combined with the rest of the graph, they almost always created a path to one of the infinite seas.
But as they talked, they hit upon an unorthodox improvement to this strategy. If they analyzed the sprinkles first, the proof got a lot simpler. What’s more, it strengthened the argument enough that it worked for all infinite transitive graphs. “We had this ping-pong of ideas,” Diskin said. “Every time you throw ideas one at another, suddenly this wall becomes more blurry, until it vanishes completely. Then it’s a bit scary, because you might actually have it.”
Finally, they were sure they had proved it: If the probability is anywhere above the critical threshold, even just a smidge, then fluid covers nearly the entire transitive graph.
Two months later, they posted a paper. Their argument applies to percolation on any infinite transitive graph. “If you zoom into every sentence in the proof, it feels very familiar and simple, but the way they put it all together is genuinely novel,” Nachmias said.
There is no shortage of unstudied percolation systems that their technique could apply to — like graphs where the nodes don’t all look identical, or more complicated models that describe freezing water or quantum materials.
A major question remains, though: On three-dimensional lattices — the graphs that most closely mirror physical systems — what happens exactly at the critical probability? Is there an infinite sea?
The progress on the problem is especially significant to Benjamini, who waited a decade for his expedition to start up again. “For the community, for us, it’s a very deep and meaningful theorem, and it’s a part of the puzzle,” he said.
Of the proof, Benjamini said, “it’s a gem. It’s a gem.”