How Modern and Antique Technologies Reveal a Dynamic Cosmos
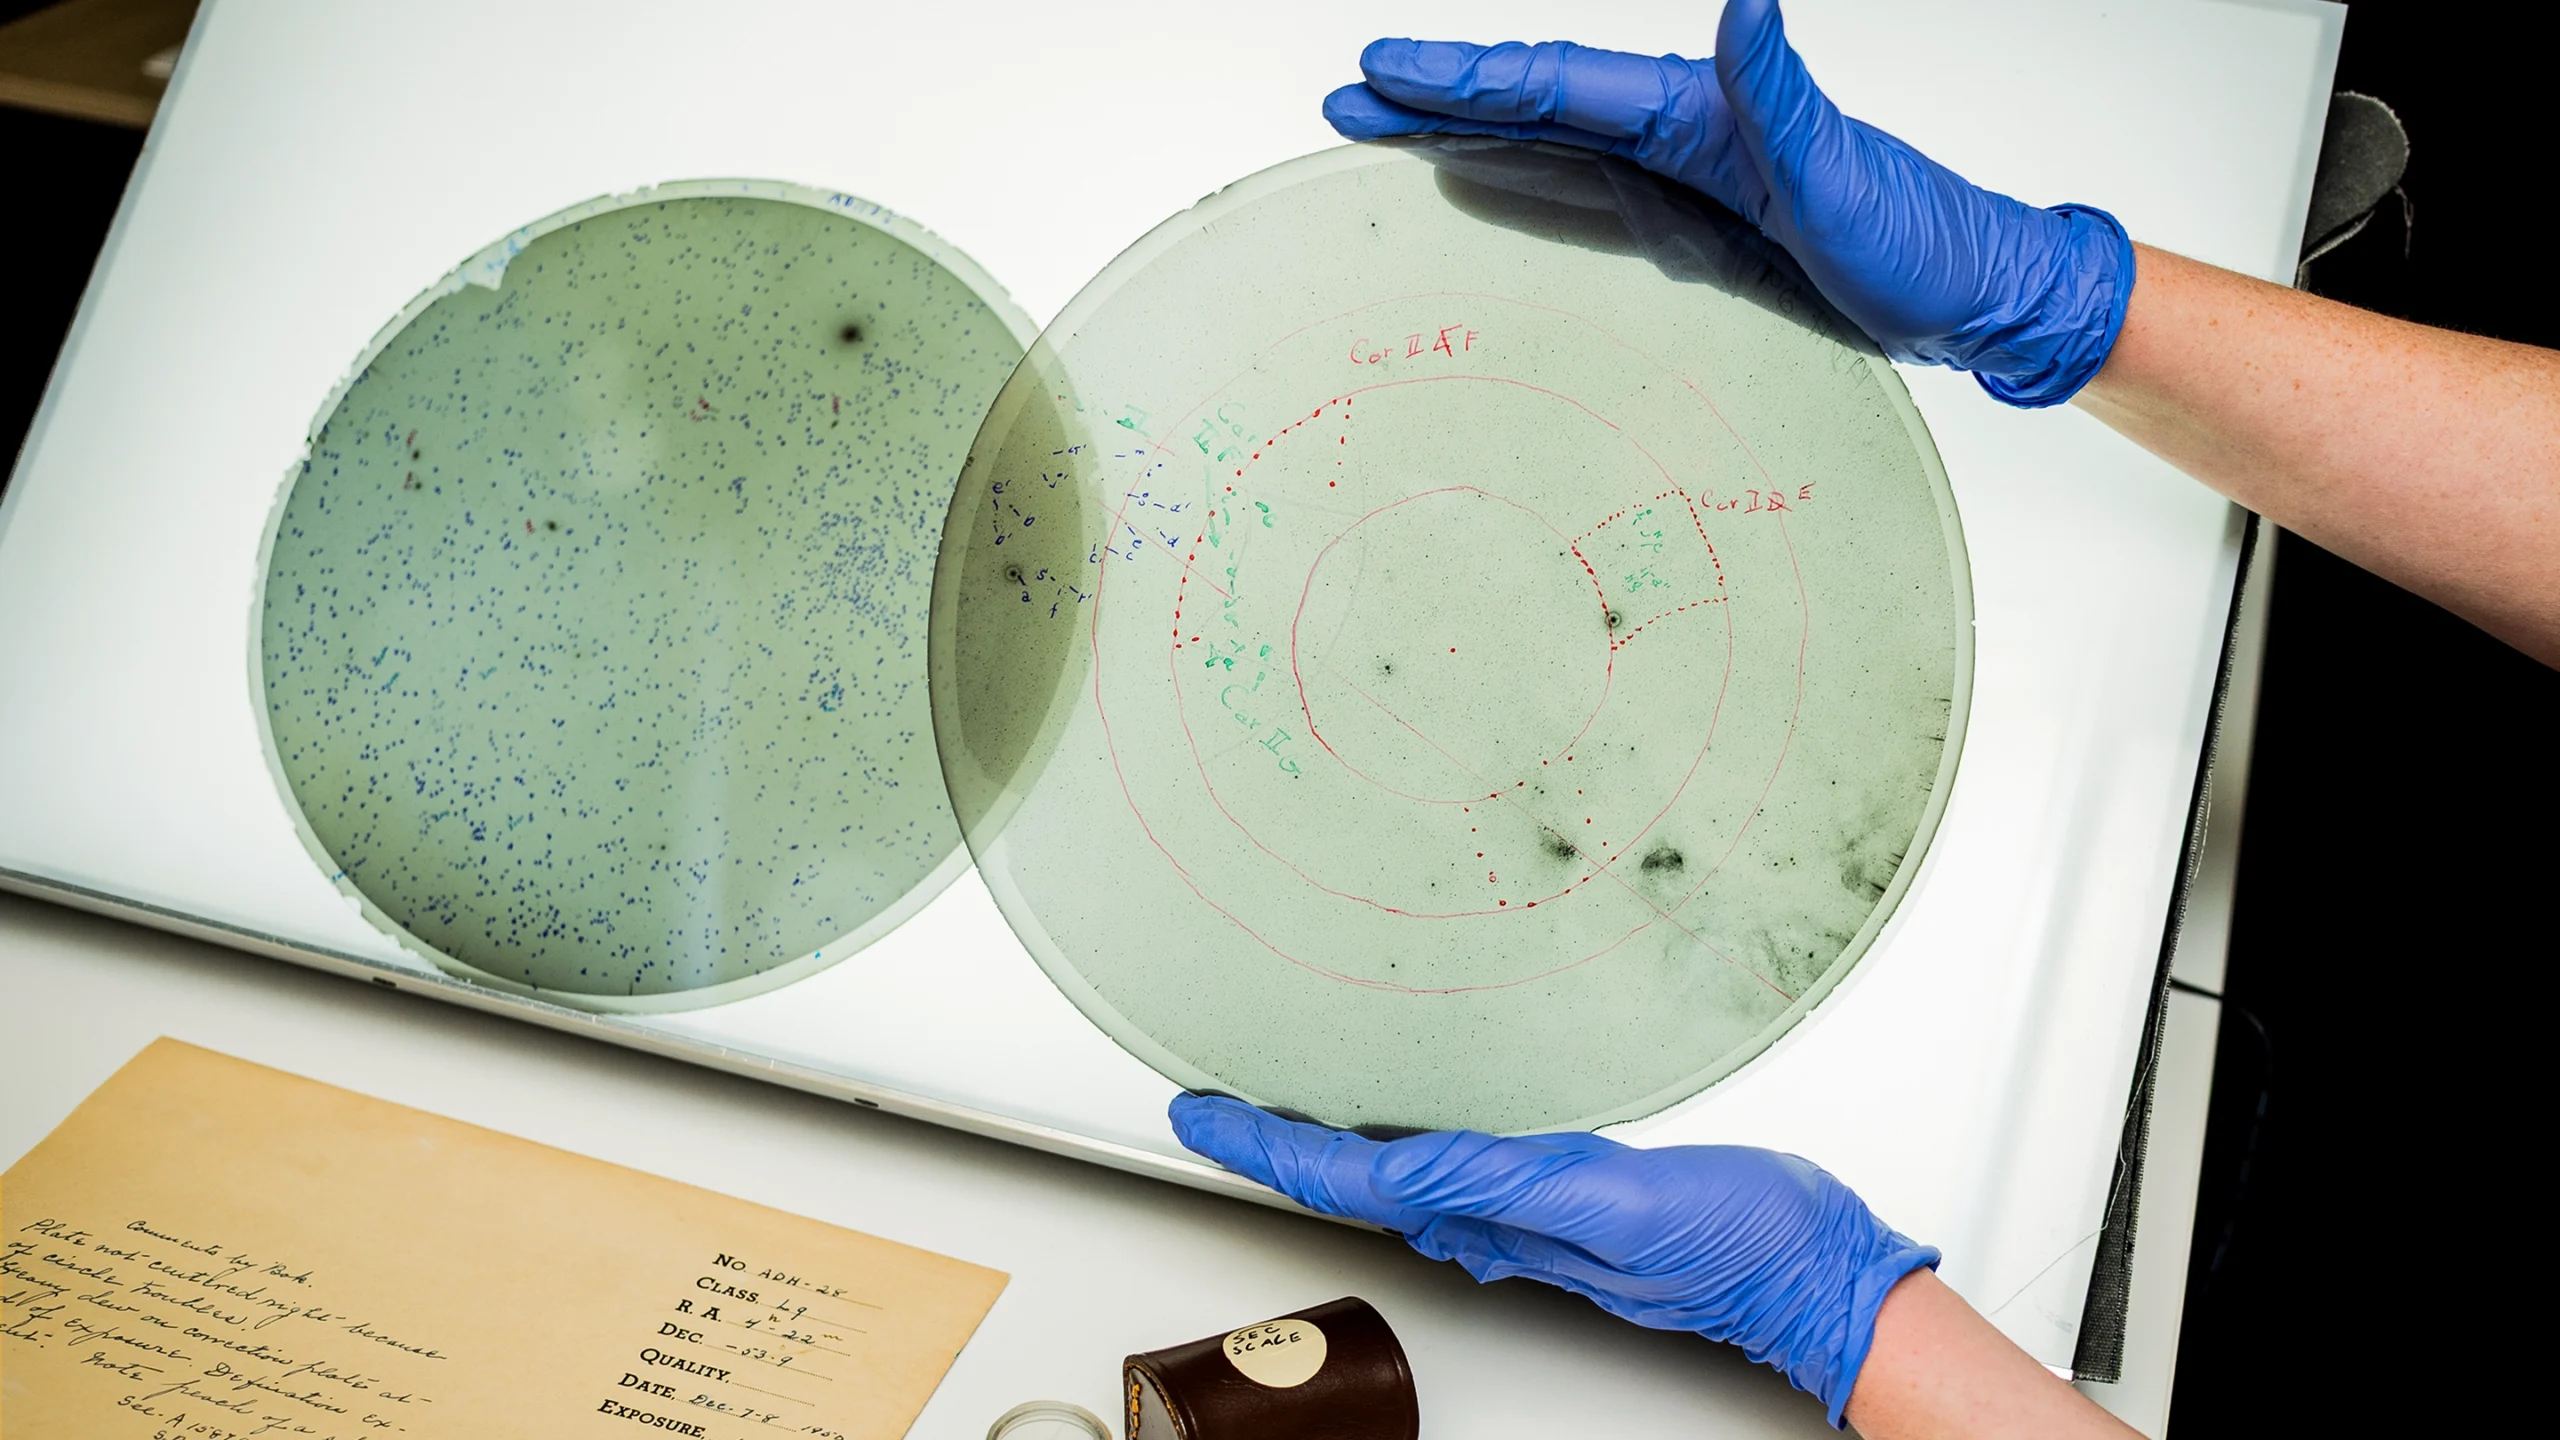
Glass plates taken at the Armagh-Dunsink-Harvard Telescope in Bloemfontein, South Africa, in 1950 and 1951 were annotated by hand.
Kayleigh MacDonald for Quanta Magazine
Introduction
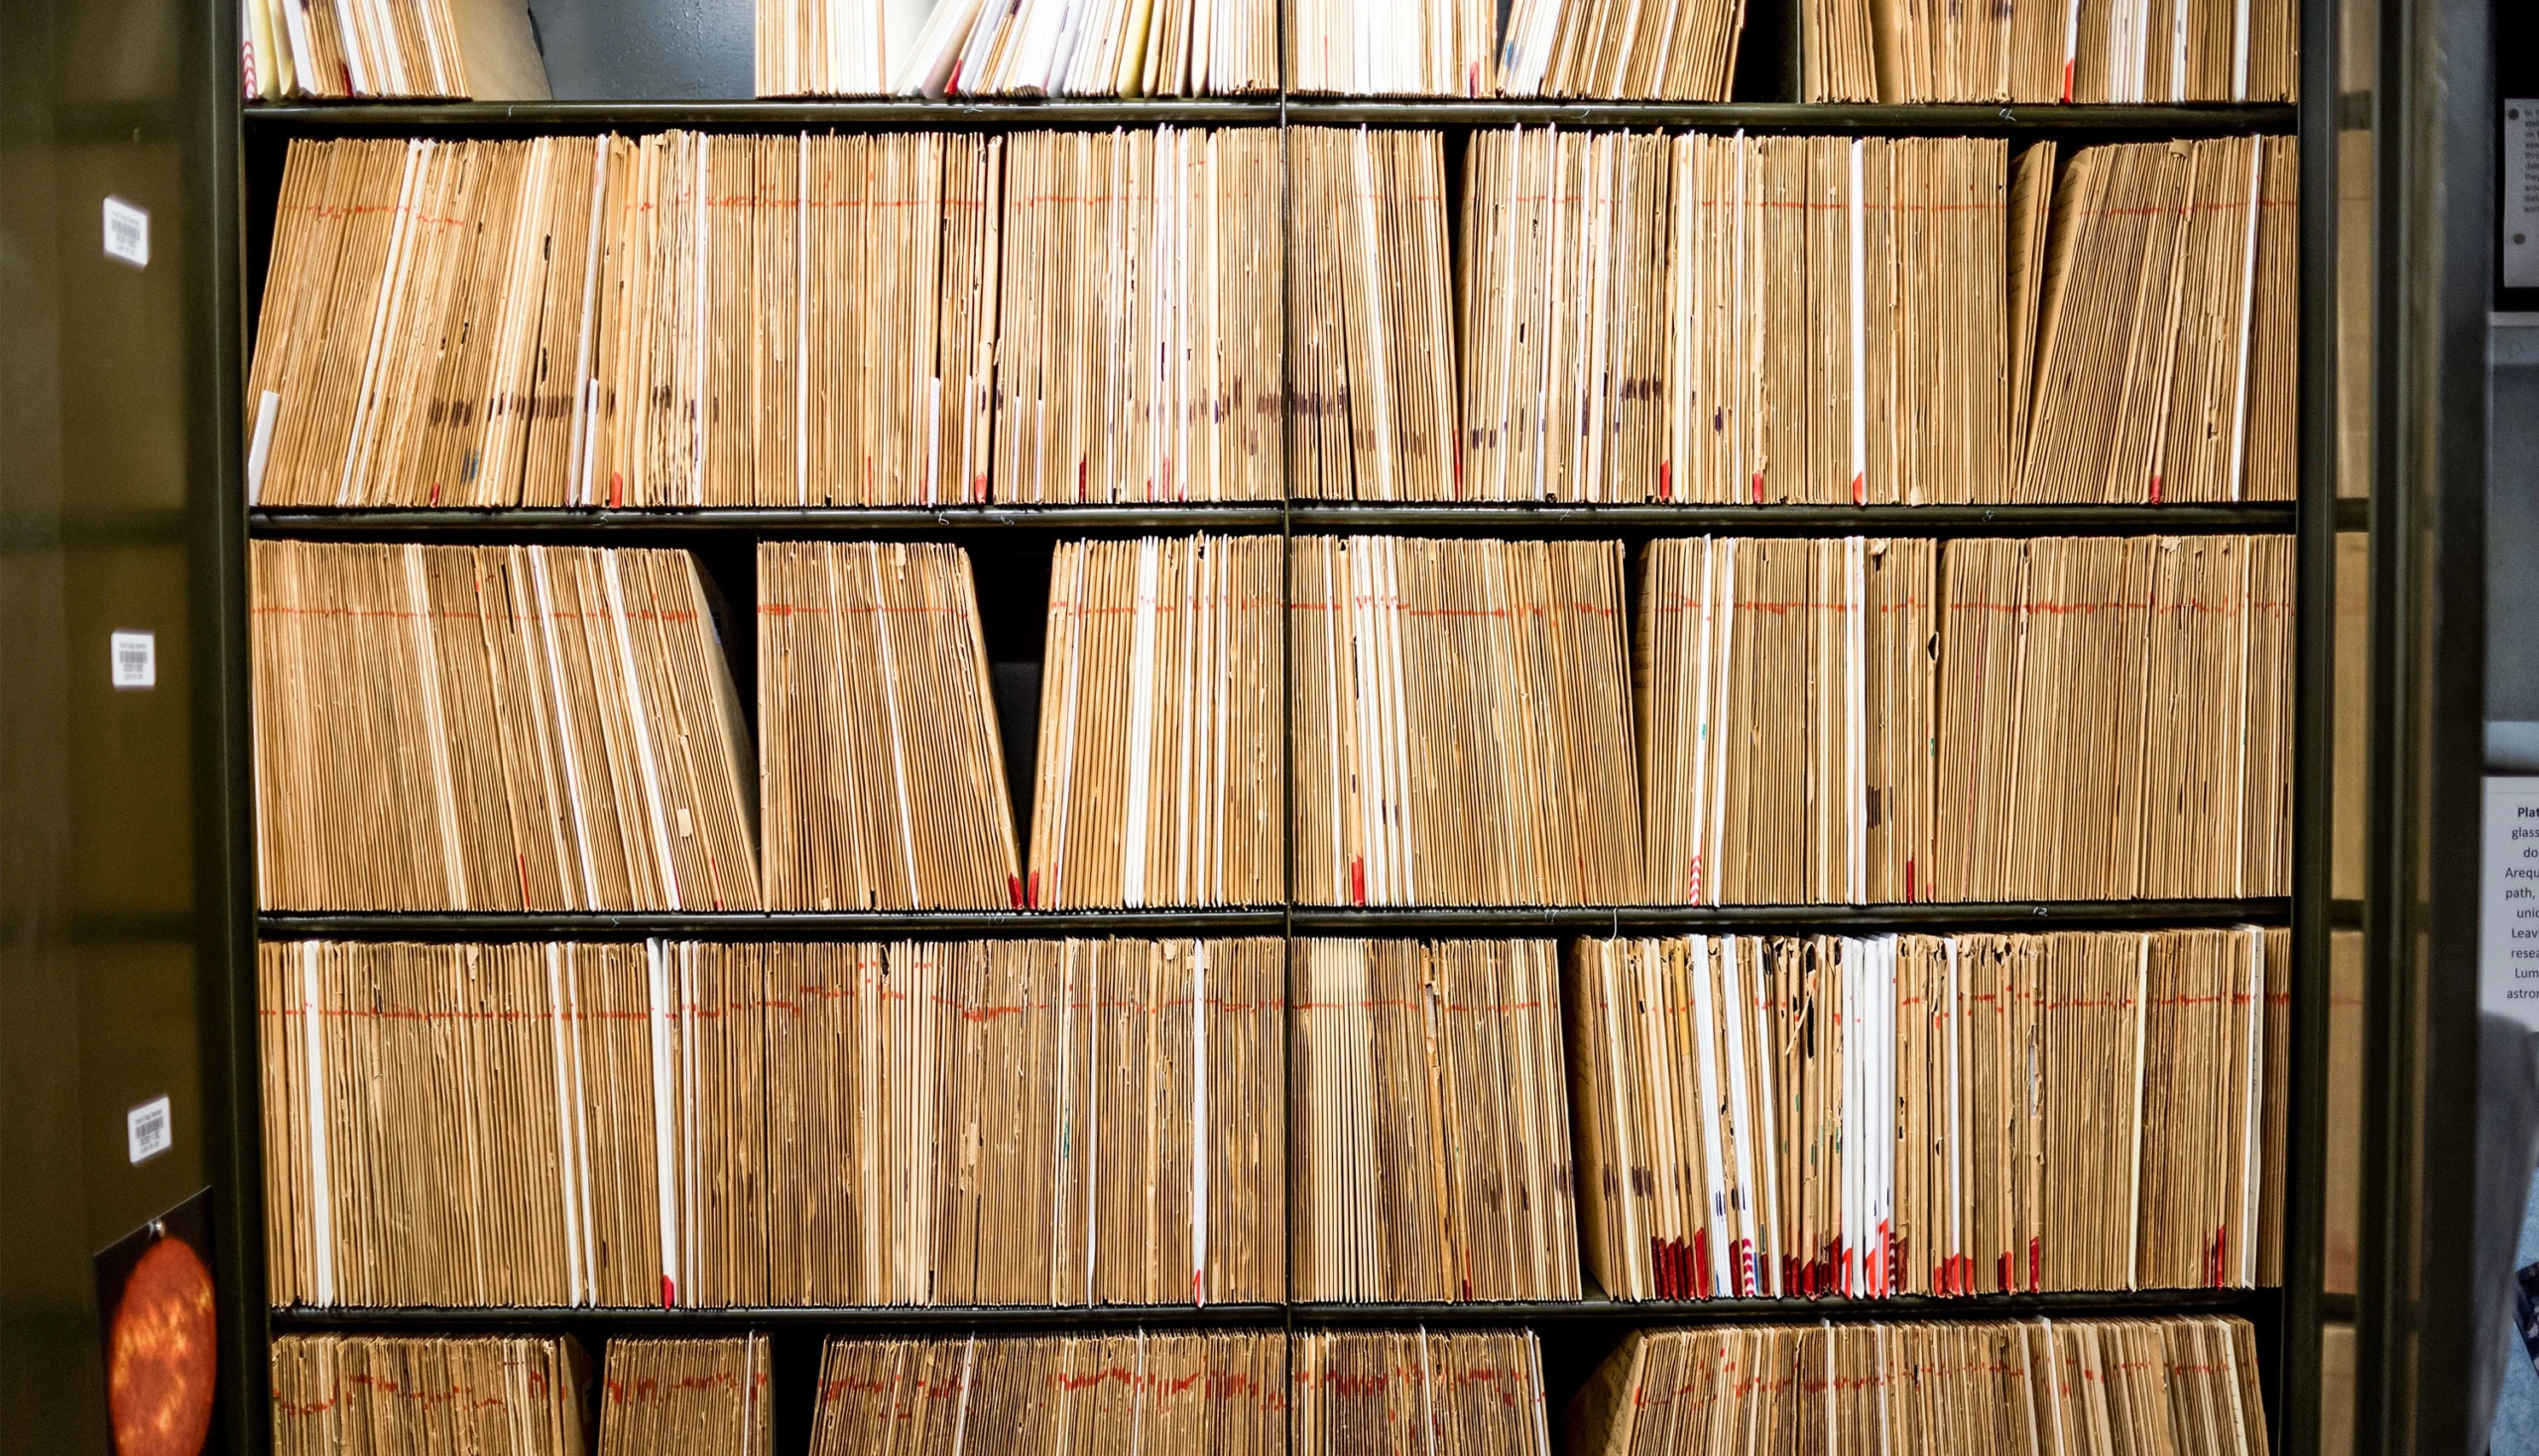
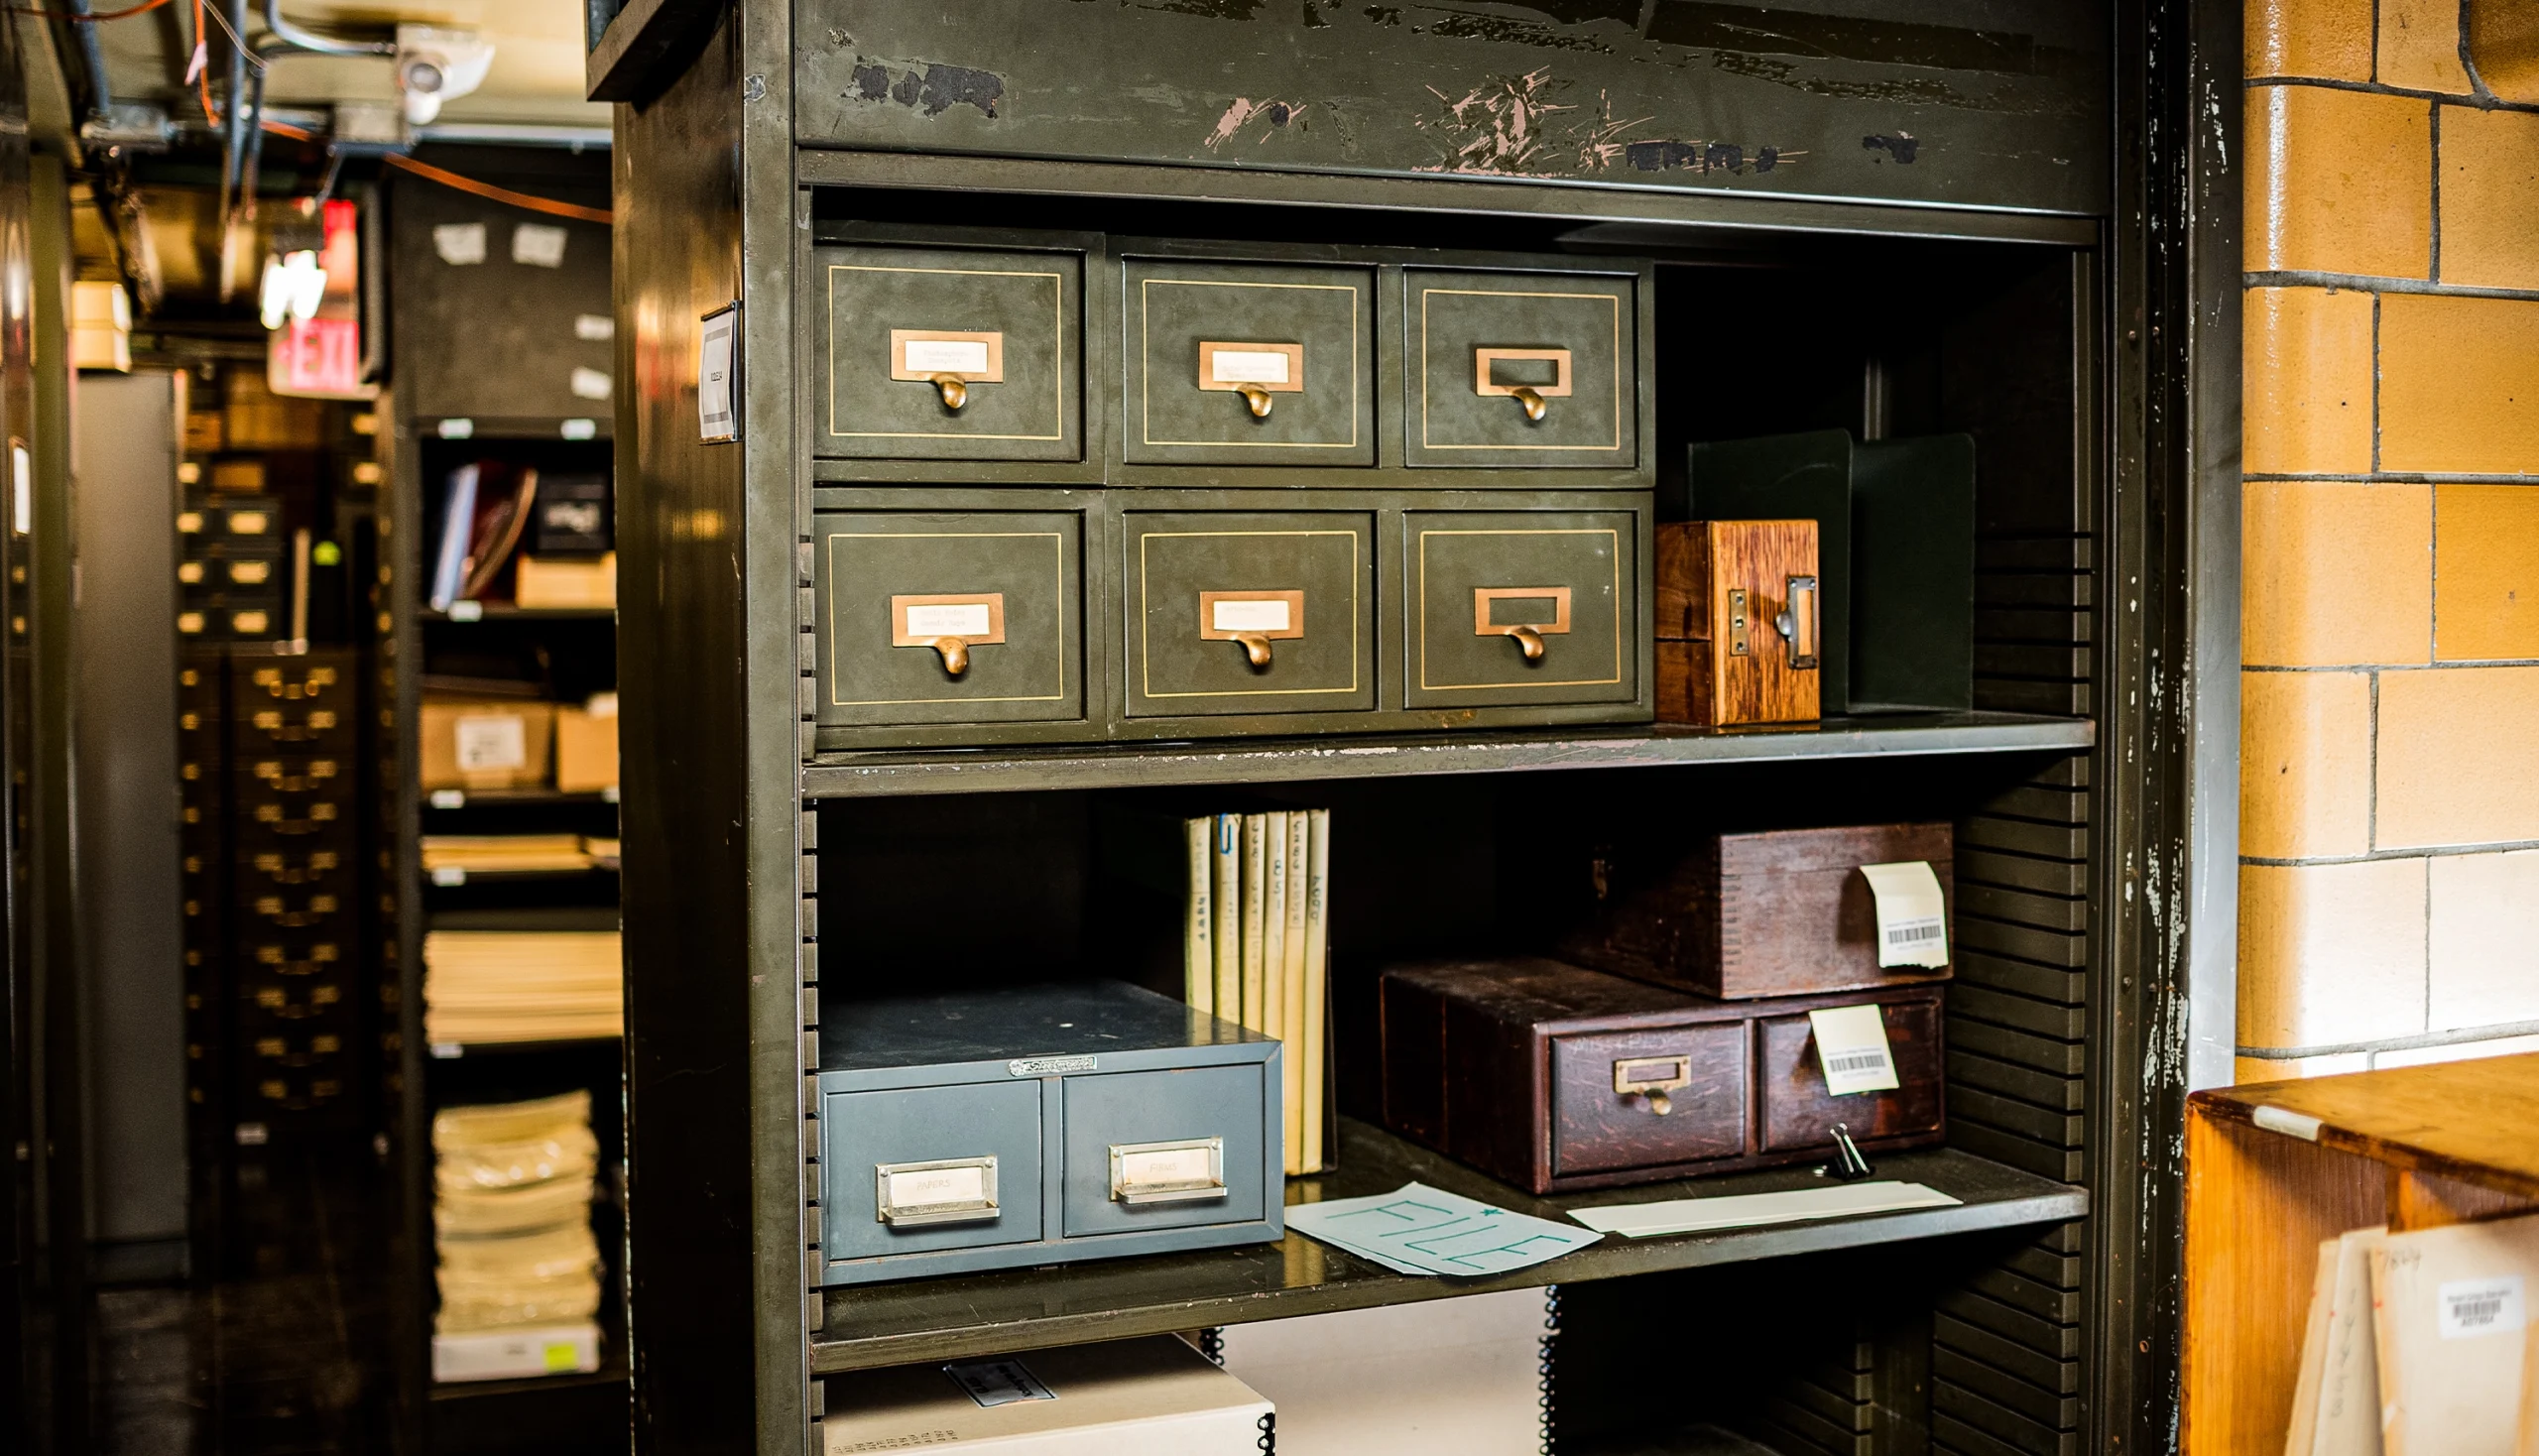
In early 2007, René Hudec was in Building D of the Harvard-Smithsonian Center for Astrophysics, thumbing through roomfuls of floor-to-ceiling cabinets that look more like a vast record collection than an academic archive. Each paper sleeve holds a glass plate, most of which are 8 by 10 inches, a historic photographic record of the cosmos from before the age of sophisticated digital detectors. Hudec, an astrophysicist at the Astronomical Institute of the Czech Academy of Sciences in Ondřejov, was searching for a specific pattern of stars that he had memorized, a region that features a binary system of mammoth yet compact objects. There, two supermassive black holes and their surrounding accretion disks are locked in a dance that will eventually merge them into one. Hudec was tracking when this system, known as OJ 287, flared in brightness.
Hudec’s archival detective work has been a success: He has found the black hole pair on more than 2,000 glass plates. The earliest with usable data was from 1896. With a magnifying glass, he examined each plate to estimate the system’s luminosity as compared to other stars in the field of view. Astronomers knew about a 1913 flare and more recent events, but Hudec ended up discovering multiple flares that were unknown to astronomy, including a major one in 1900.
With this new — well, old — data, Hudec and his colleagues could better model the system and begin to understand the physics that leads to the flares. “The discoveries and exact timing of historical outbursts,” he said, help to “tune the model parameters.” One of the black holes is substantially more massive than the other. As the less massive one passes through the other’s accretion disk, it creates fireworks that coincide with the historical flares he spotted.
OJ 287 and other active black holes are just one type of celestial object or system that varies in brightness over time. But the universe is full of objects that fluctuate periodically or that quickly burst forth and then disappear. The night sky, for all its apparent consistency, simmers and sparks. In fact, “every astrophysical object can be considered a transient or a variable in a different timescale,” said Rosaria Bonito, an astrophysicist at the Palermo Astronomical Observatory of the National Institute for Astrophysics in Italy. Any attempt to understand what we see in the cosmos relies on knowing how it changes, night after night.
This notion that the sky above is ever-changing led to the development of the newest large astronomical observatory. The Vera C. Rubin Observatory, high in the Chilean Andes, is beginning, in early 2026, a 10-year survey that will monitor all things that change and move, to reveal what astronomers call the time-domain universe. With data from previous telescopes — in both digital form and on glass — the project promises a brilliantly dynamic view. The value of the Rubin telescope lies not just in the reams of data it will create, but in its potential to connect today’s observations to more than a century of meticulous work. Within vast analog collections, many of which are at risk of disappearing, lie unexplored connections to today’s changing cosmos. Pulling together the modern and the historical could reveal a century-long movie of the sky above us.
The Only Constant Is Change
Far from light-polluted cities, one can see meteors racing across the night sky. Jupiter and Mars move faster than distant stars on that same nightly view. There are many, many other changes that human eyes aren’t sensitive enough to perceive.
“Everything in the cosmos is changing, nothing is static,” said Elizabeth Griffin, an astronomer at the Herzberg Astronomy and Astrophysics Research Center in Victoria, Canada. “The changes may be quite quick, quite periodic; may be explosive, may be sudden; or they may be terribly, terribly slow.”
All these variations comprise the dynamic universe that astronomers are working to reveal. Matthew Graham, an astronomer at the California Institute of Technology, separates the objects studied by time-domain astronomy into two groups: things that go bang, and things that fluctuate. The former are also known as transients, and they change quickly. These include the largest blasts in the universe, such as supernova explosions and gamma-ray bursts.
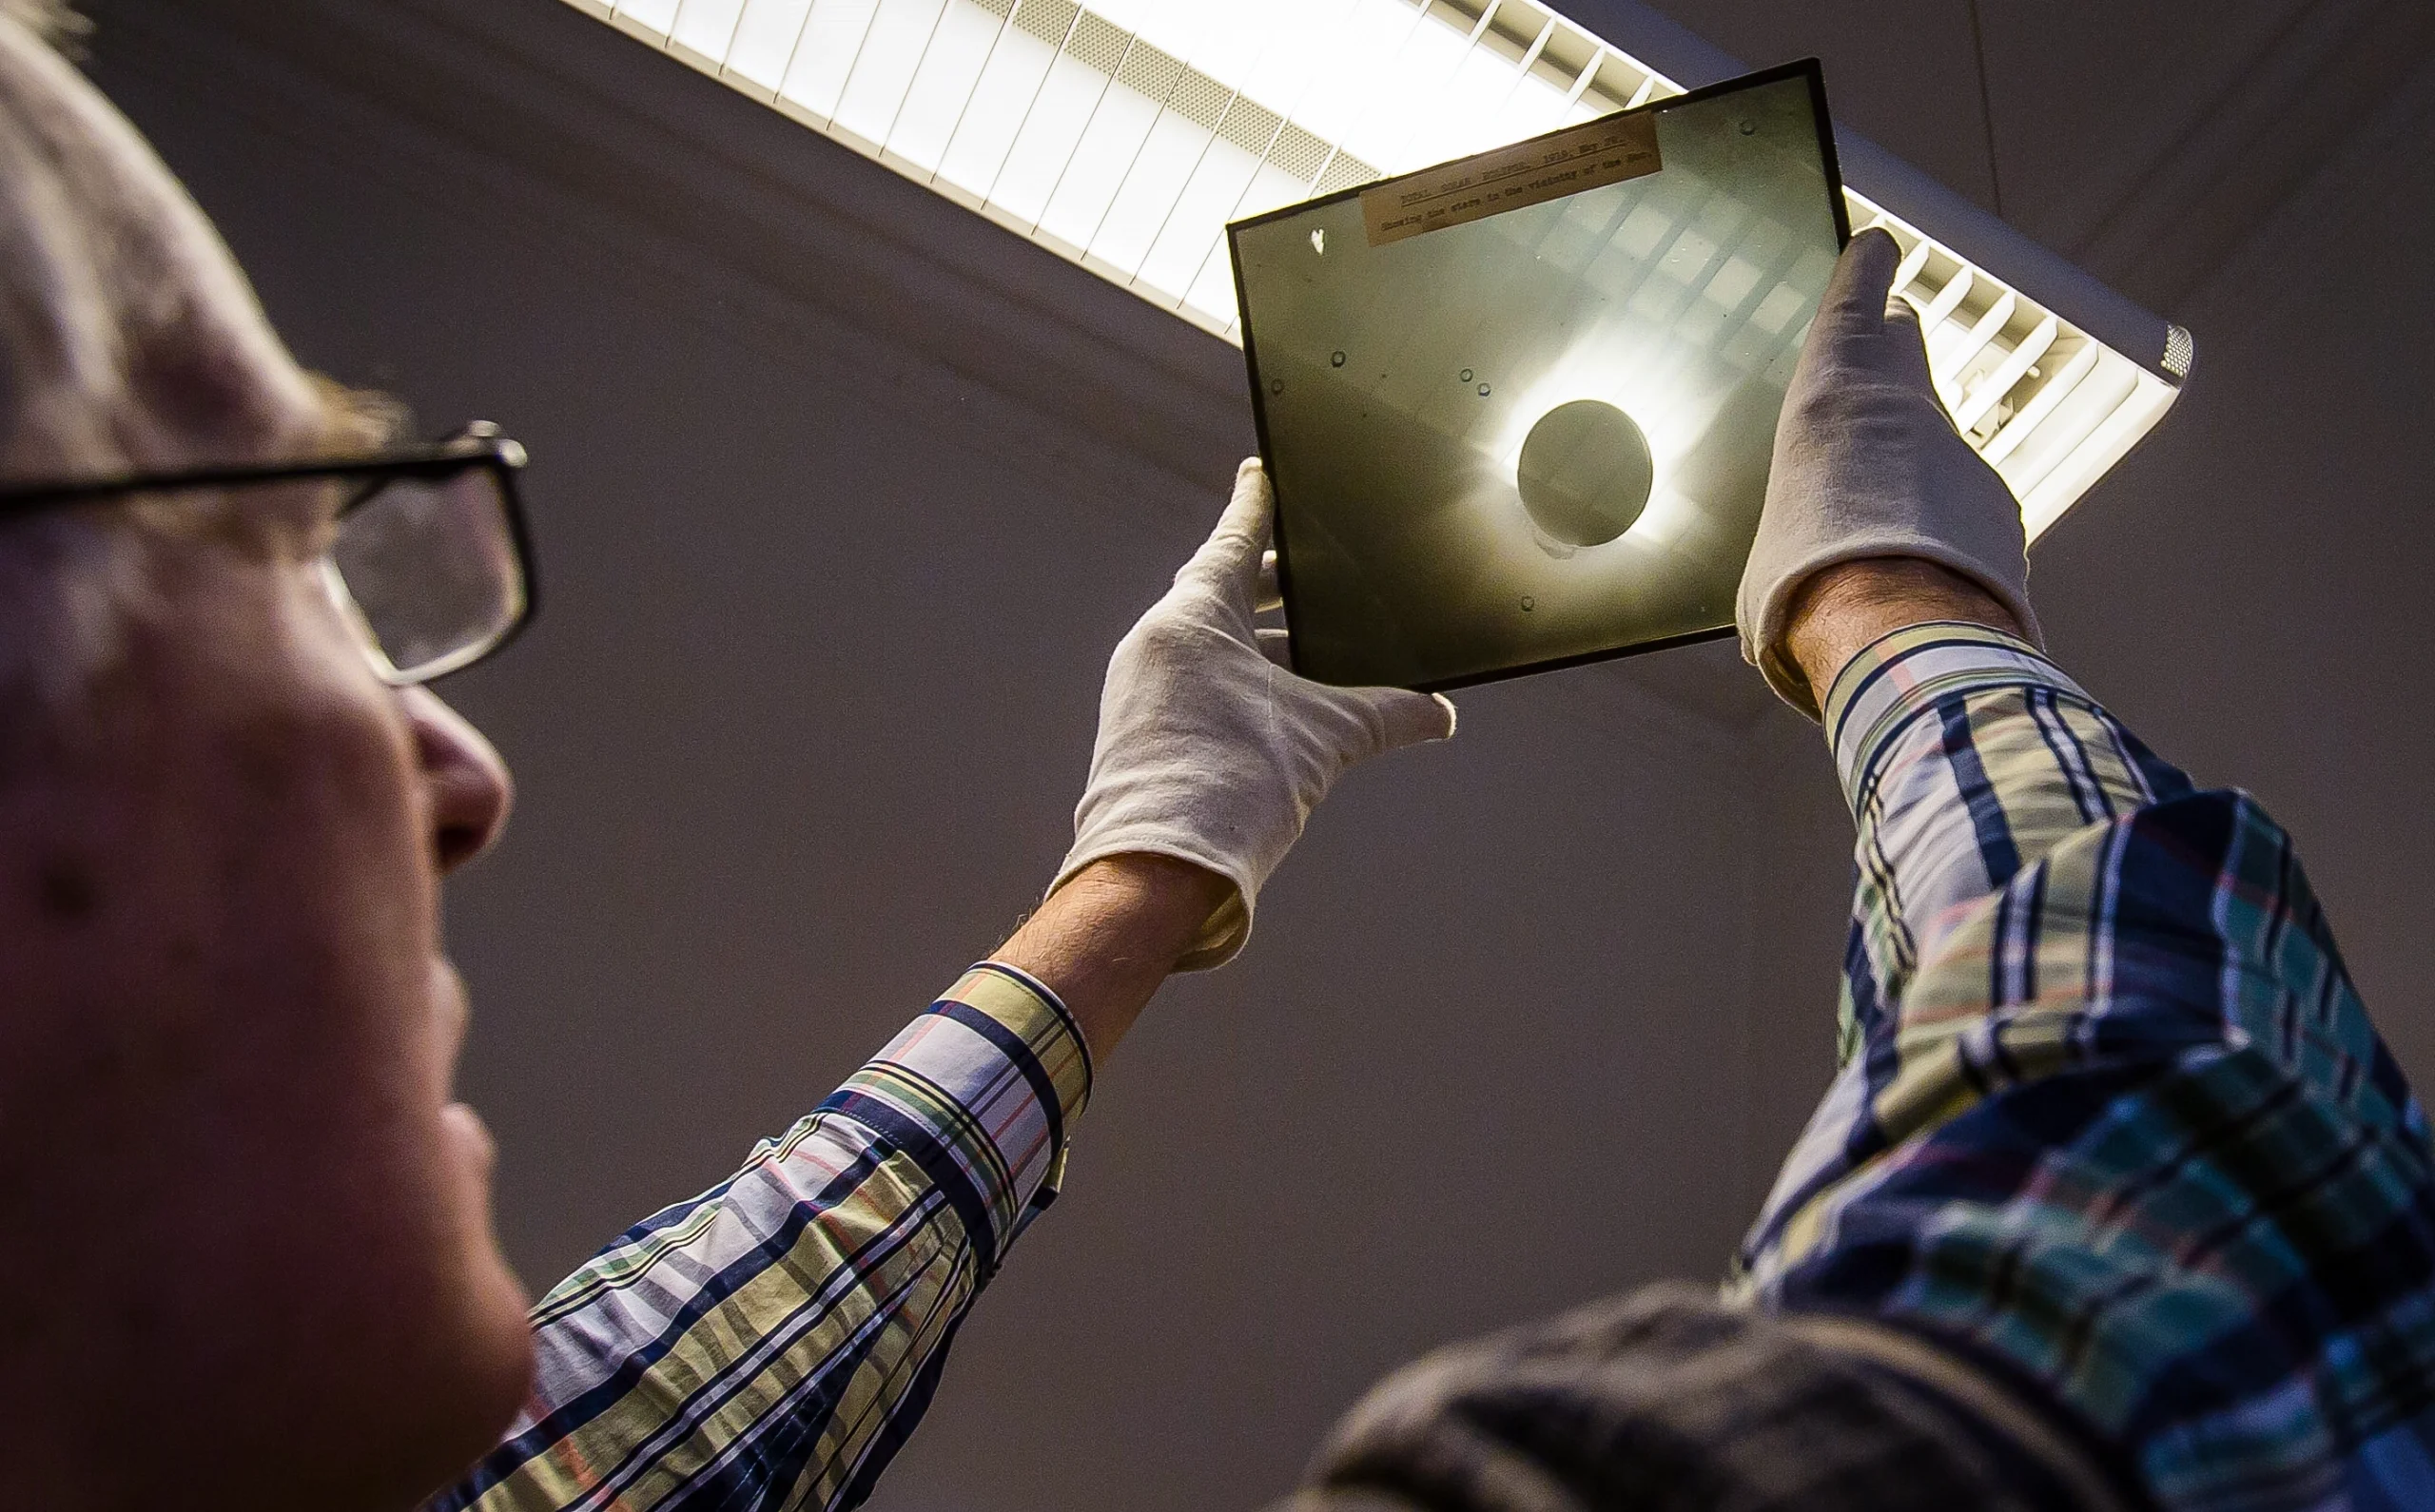
A photographic plate at the Neils Bohr Institute in Copenhagen captures the 1919 solar eclipse that was used to confirm Einstein’s theory of general relativity.
Niels Bohr Institute, Copenhagen University
The second category, variable objects, includes a wide variety of solo stars including the Cepheids, which fluctuate at a rate that reveals their intrinsic brightness (making them very valuable for measuring galactic distances). Systems of binary stars also fall into this category, as their observed brightness changes depending on where each star is, if one is passing in front of the other, and if one is siphoning material from the other.
The actively accreting black holes at the cores of galaxies also vary over time, “across all wavelengths and across all sorts of timescales,” said Graham, who studies this variability. These phenomena can tell astronomers and astrophysicists how physics operates within the most extreme environments. Any theoretical model that describes how those active galactic nuclei (AGNs) emit flares and produce other brightness variations must match the actual observations. That’s where time-domain astronomy comes in: Tracking the changes over a year, a decade, or a century gives astrophysicists specific markers for a model to match.
The full scope of celestial changes helps set boundaries on astronomers’ theoretical understanding: Exploding stars help cosmologists measure extragalactic distances, while variations in stellar brightness can reveal details of how stars evolve.
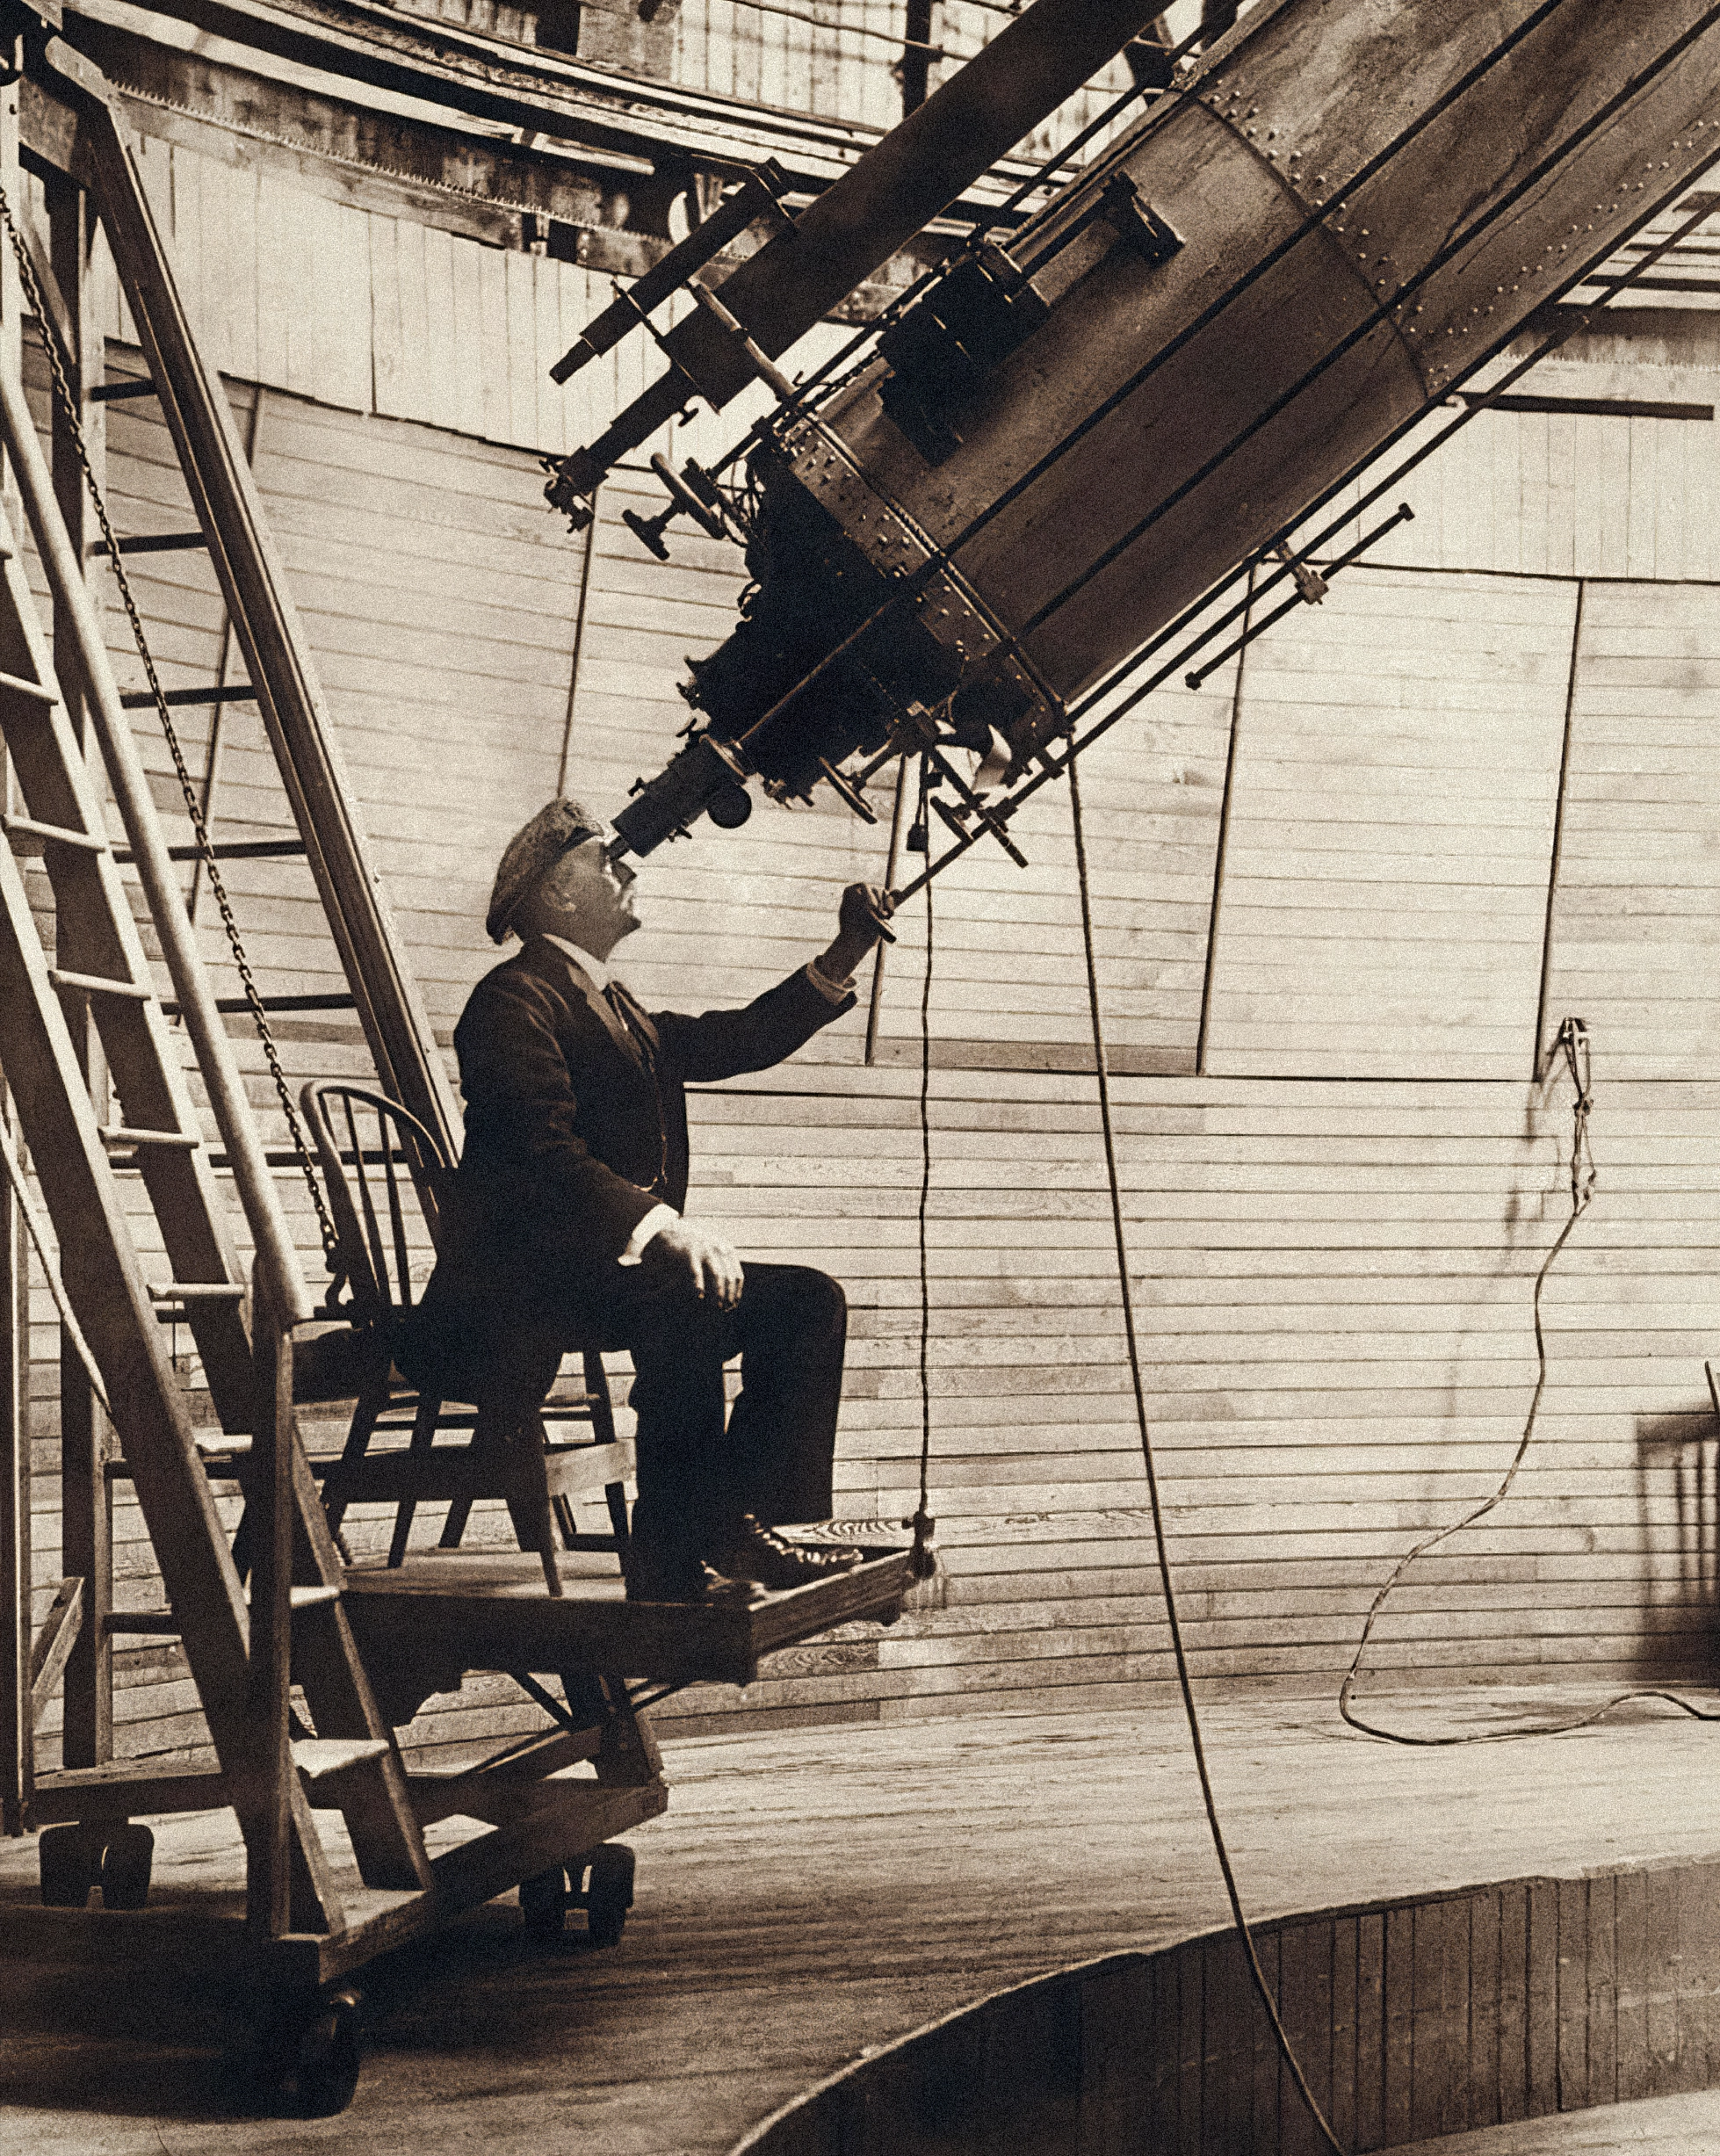
Astronomer Percival Lowell peers through the eyepiece of the telescope at the observatory that bears his name in Flagstaff, Arizona. It was there that, in 1930, Clyde Tombaugh found Pluto in a time series of photographs.
Historic Images/Alamy
To find these changes across time, astronomers use software to quickly scour data captured via modern telescopes and their powerful digital cameras. This has been the method of choice for some 40 years. But prior to the development of digital imaging detectors, astronomers used analog photography and glass plates. To find changes in the dynamic sky, human eyes carefully compared plate images captured at different times. Both collecting the data and discovering celestial variations took a great deal more time during the century of analog astrophotography.
New Eye on the Sky
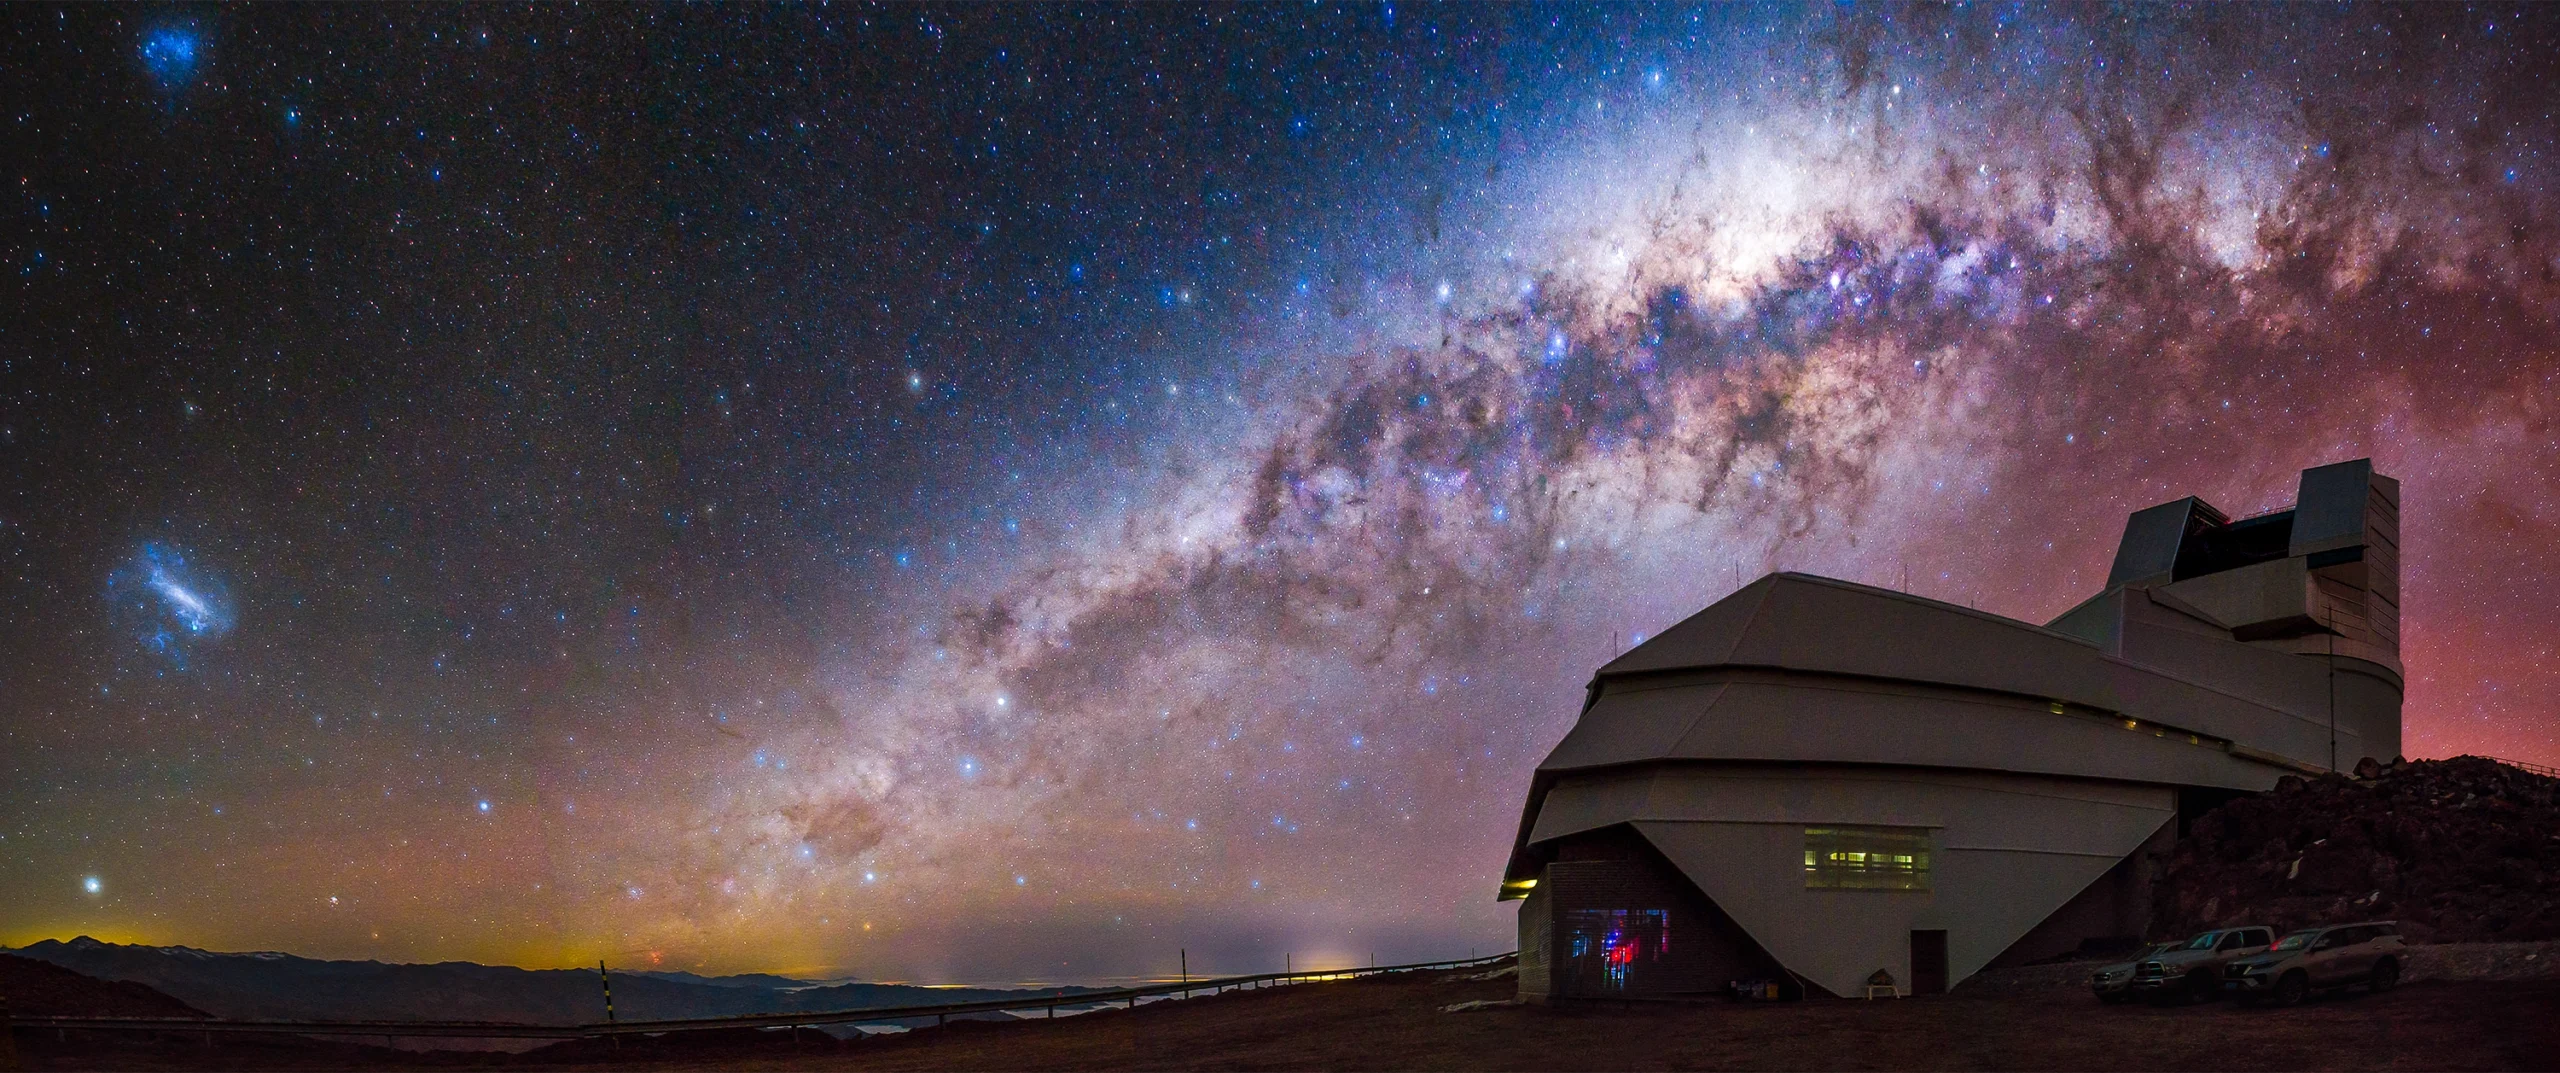
The Vera C. Rubin Observatory will study nearly the entire sky visible from atop Cerro Pachón in Chile with its wide-angle camera system. Its aim is to reveal millions of new objects, both in the solar system and much farther beyond, by comparing images taken at different times. It is the same technique that Clyde Tombaugh used to discover Pluto at the Lowell Observatory in Arizona nearly 100 years ago. Tombaugh took thousands of hourlong photographs over the course of months and examined them visually to document the faint object on the edge of the solar system.
The Rubin Observatory, on the other hand, boasts a camera that is the largest ever built for any purpose. In one 15-second exposure, Rubin can reveal objects more than 2,500 times fainter than what the Pluto scope saw, and some 40 million times fainter than what unaided human eyes can see. Its Legacy Survey of Space and Time (LSST) project will tile the sky, repeatedly moving from each 3.5-degree-wide field (seven full moons side by side) to the next. Over the next 10 years, it will image the southern sky some 1,000 times in six color filters, from ultraviolet through visible light and into infrared, bringing ever-fainter objects into view. Rubin will show a constantly changing cosmos, filled with moving objects, stars that vary in brightness, and stellar explosions. Comparing the view of the sky before Rubin to after, Bonito likens it to music, “from a single note to chords.”
Once the survey has ramped up, the Rubin team estimates that the observatory will collect 20 terabytes of data every evening. Software automatically compares the just-captured images to previous ones of the same location. If anything has changed, it sends an alert within a minute. “It’s basically a small packet of information that [tells] you when, where, and by how much a source has changed its luminosity,” said Igor Andreoni, an astrophysicist at the University of North Carolina, Chapel Hill who co-chairs the Rubin variable stars and transients group.
There will be a lot of alerts; the Rubin team expects to send more than 20 billion of them over the 10-year survey. Anyone can receive them, but no one can expect to comb through them all. To manage the torrent, researchers are writing their own code to sort the alerts. For example, Andreoni is looking for anything that has shown brightness changes in at least three images in a row, and specifically cases of a star that’s stretched and changed by getting too close to a black hole — a tidal disruption event.
The Rubin Observatory will capture these changes over hours and days and eventually a decade. But many cosmic variations happen over much longer time spans, and there have certainly been countless transients in decades past that were unnoticed or undocumented in their time. If researchers want to access time-domain astronomy beyond the past few decades, the antique technology Tombaugh used remains vital. But there are no alerts for glass photographic plates.
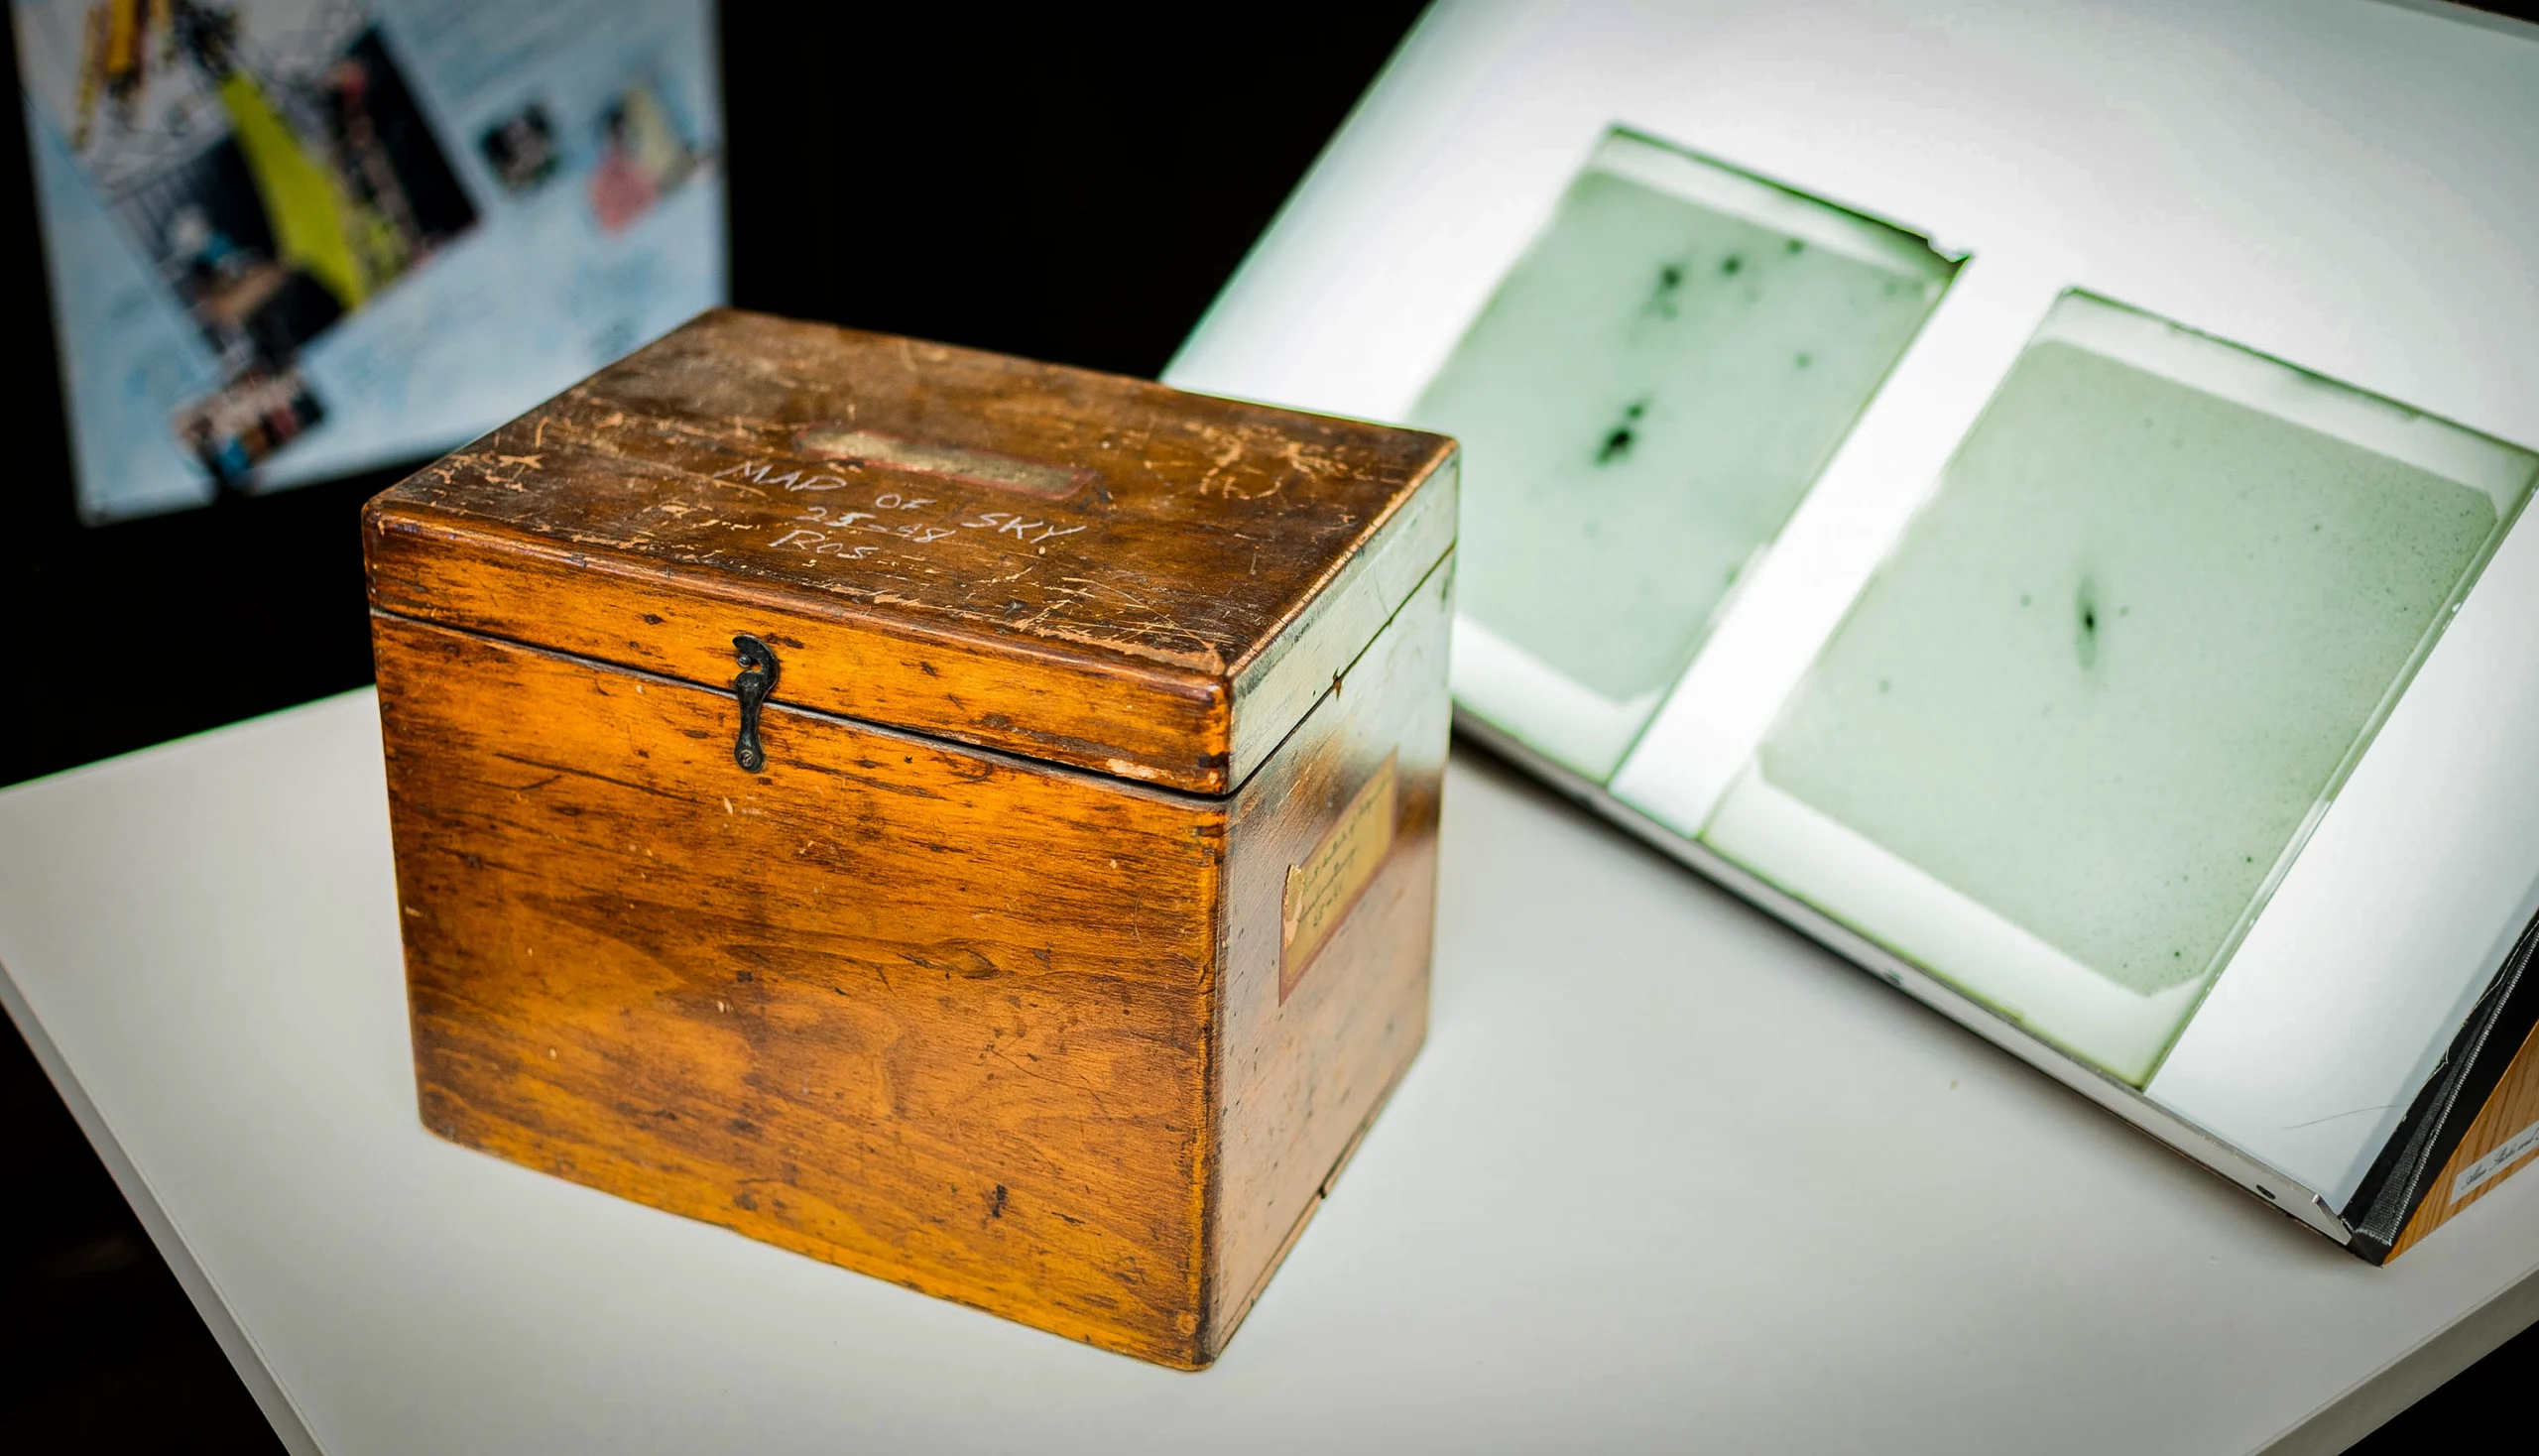
The Glass Sky
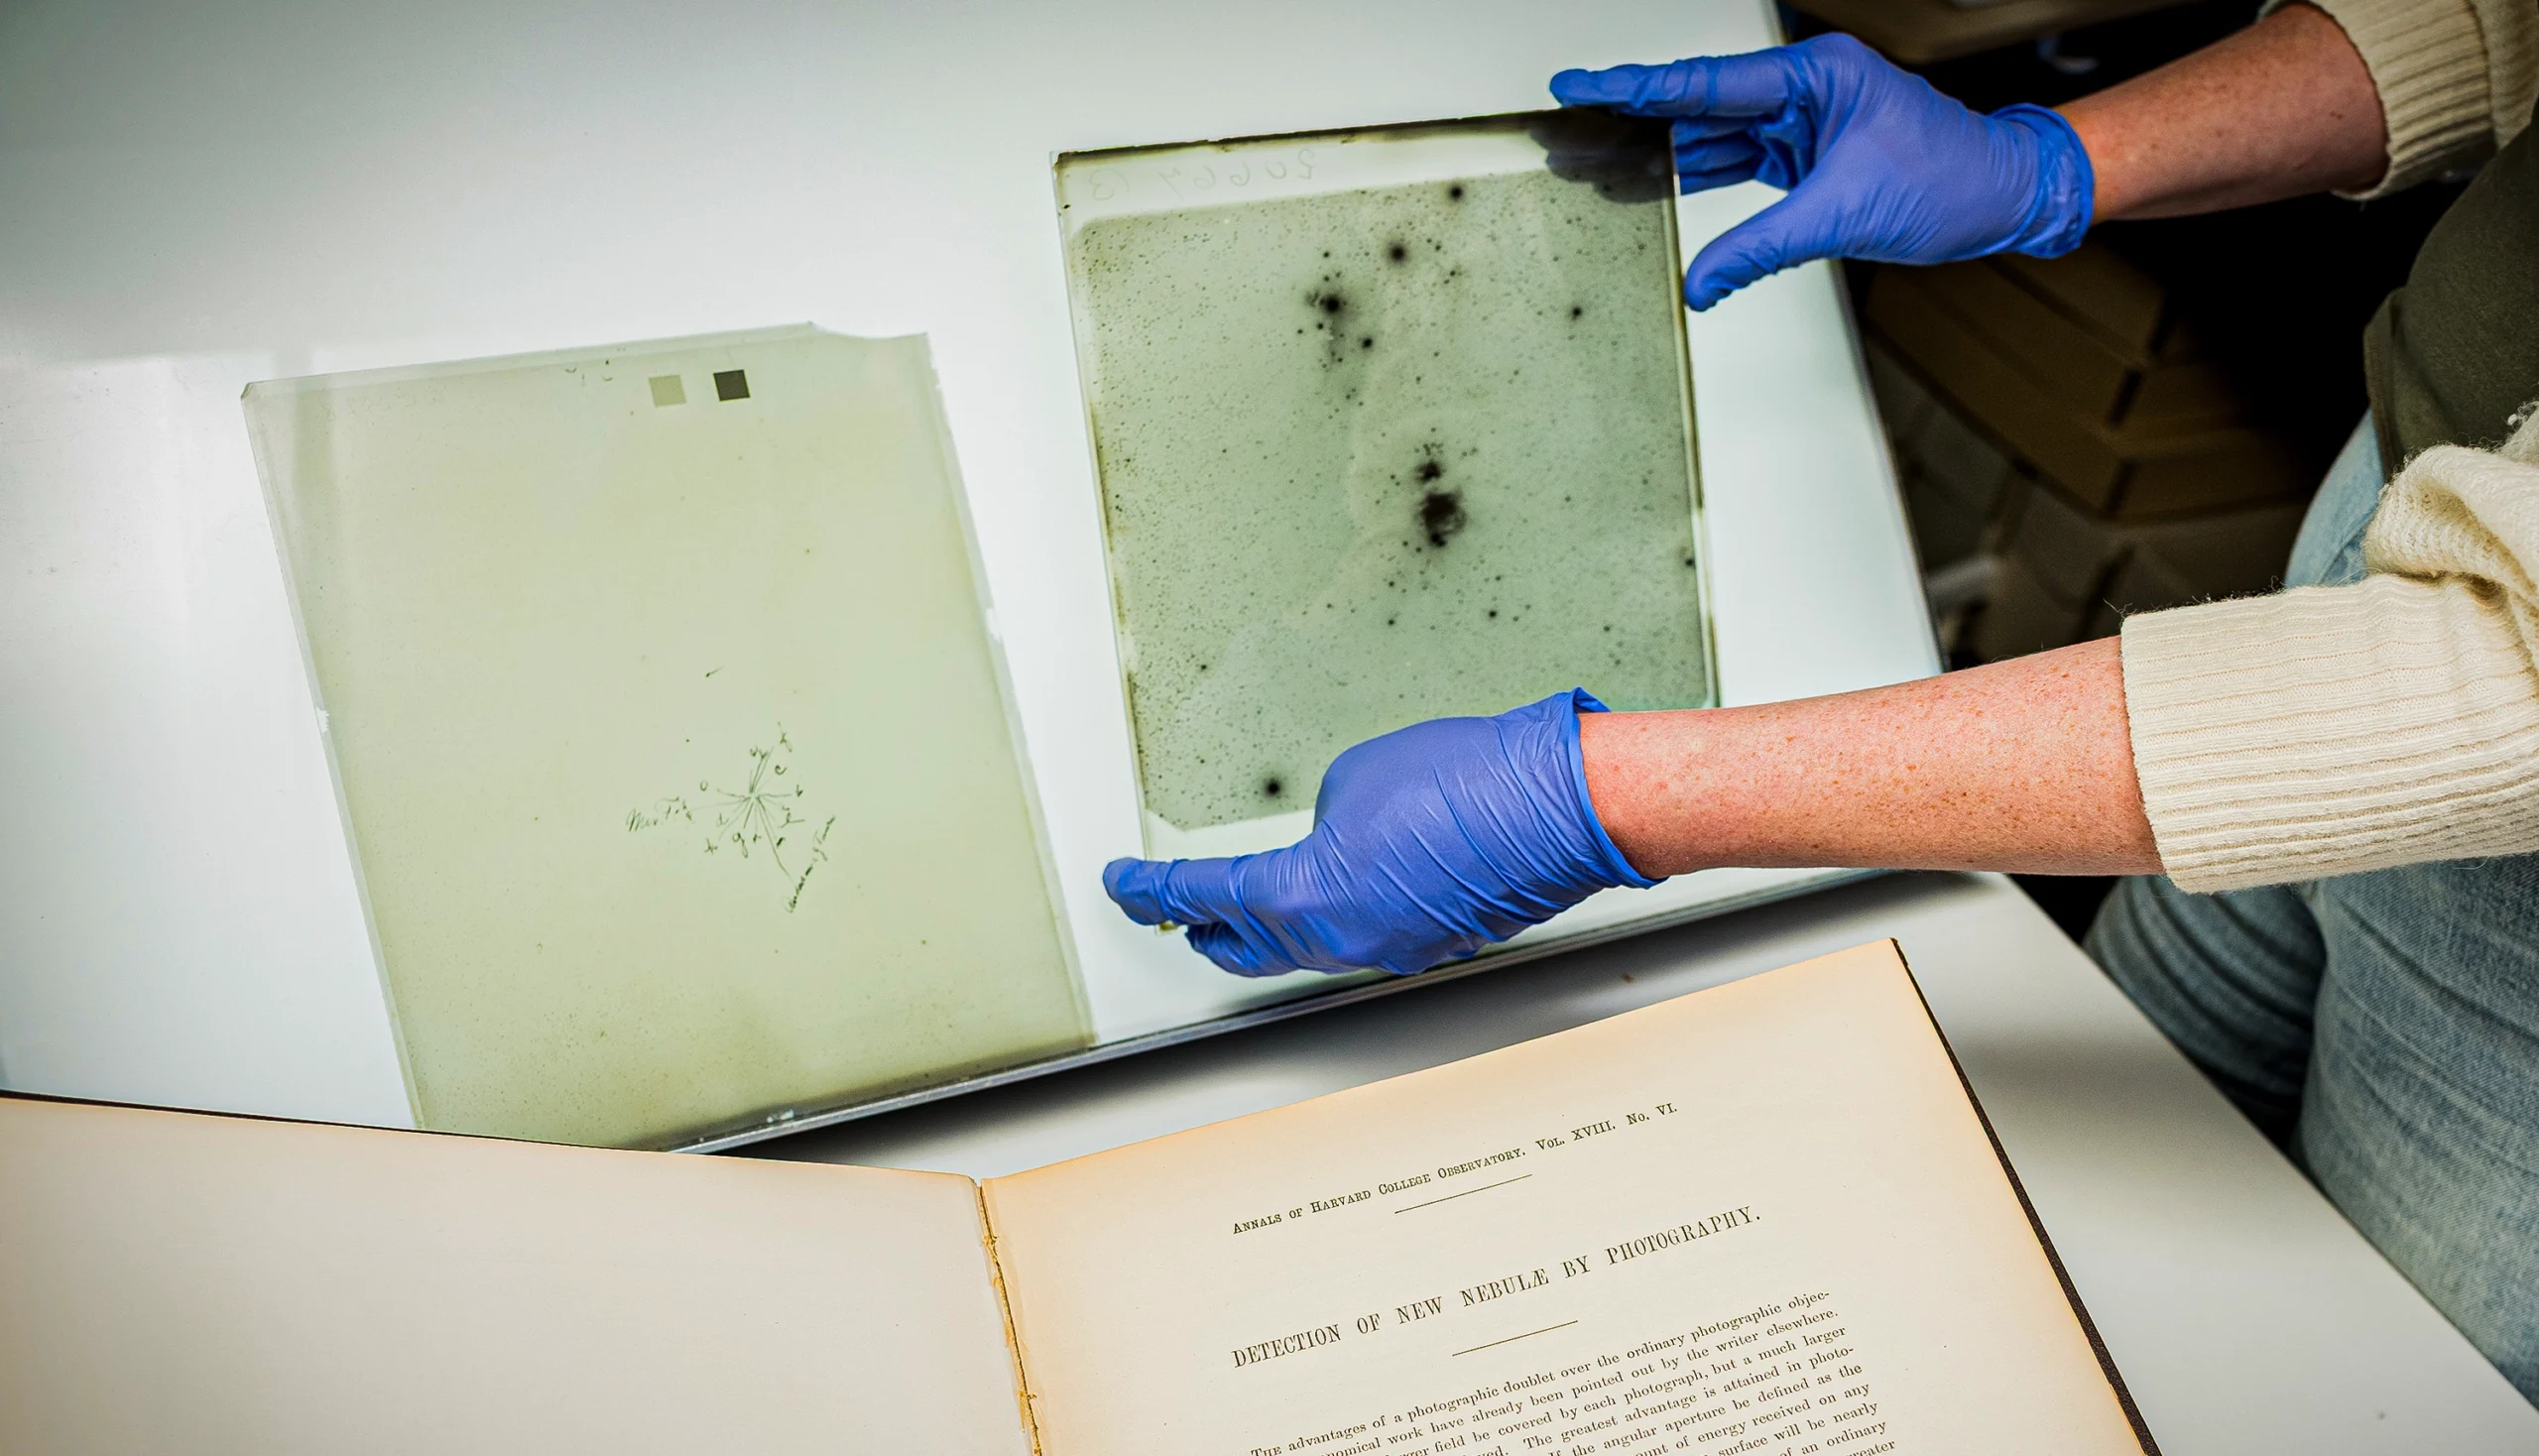
Astronomical photography before around 1980 looked very different than it does in the digital age. Scientists such as Tombaugh imaged the sky on rectangular panes of glass coated on one side in a biochemical emulsion. As starlight passed through a telescope, it hit the emulsion on the plate. When scientists developed the plates, any spots where starlight hit the emulsion would be dark. The density of the darkness corresponded to brighter starlight.
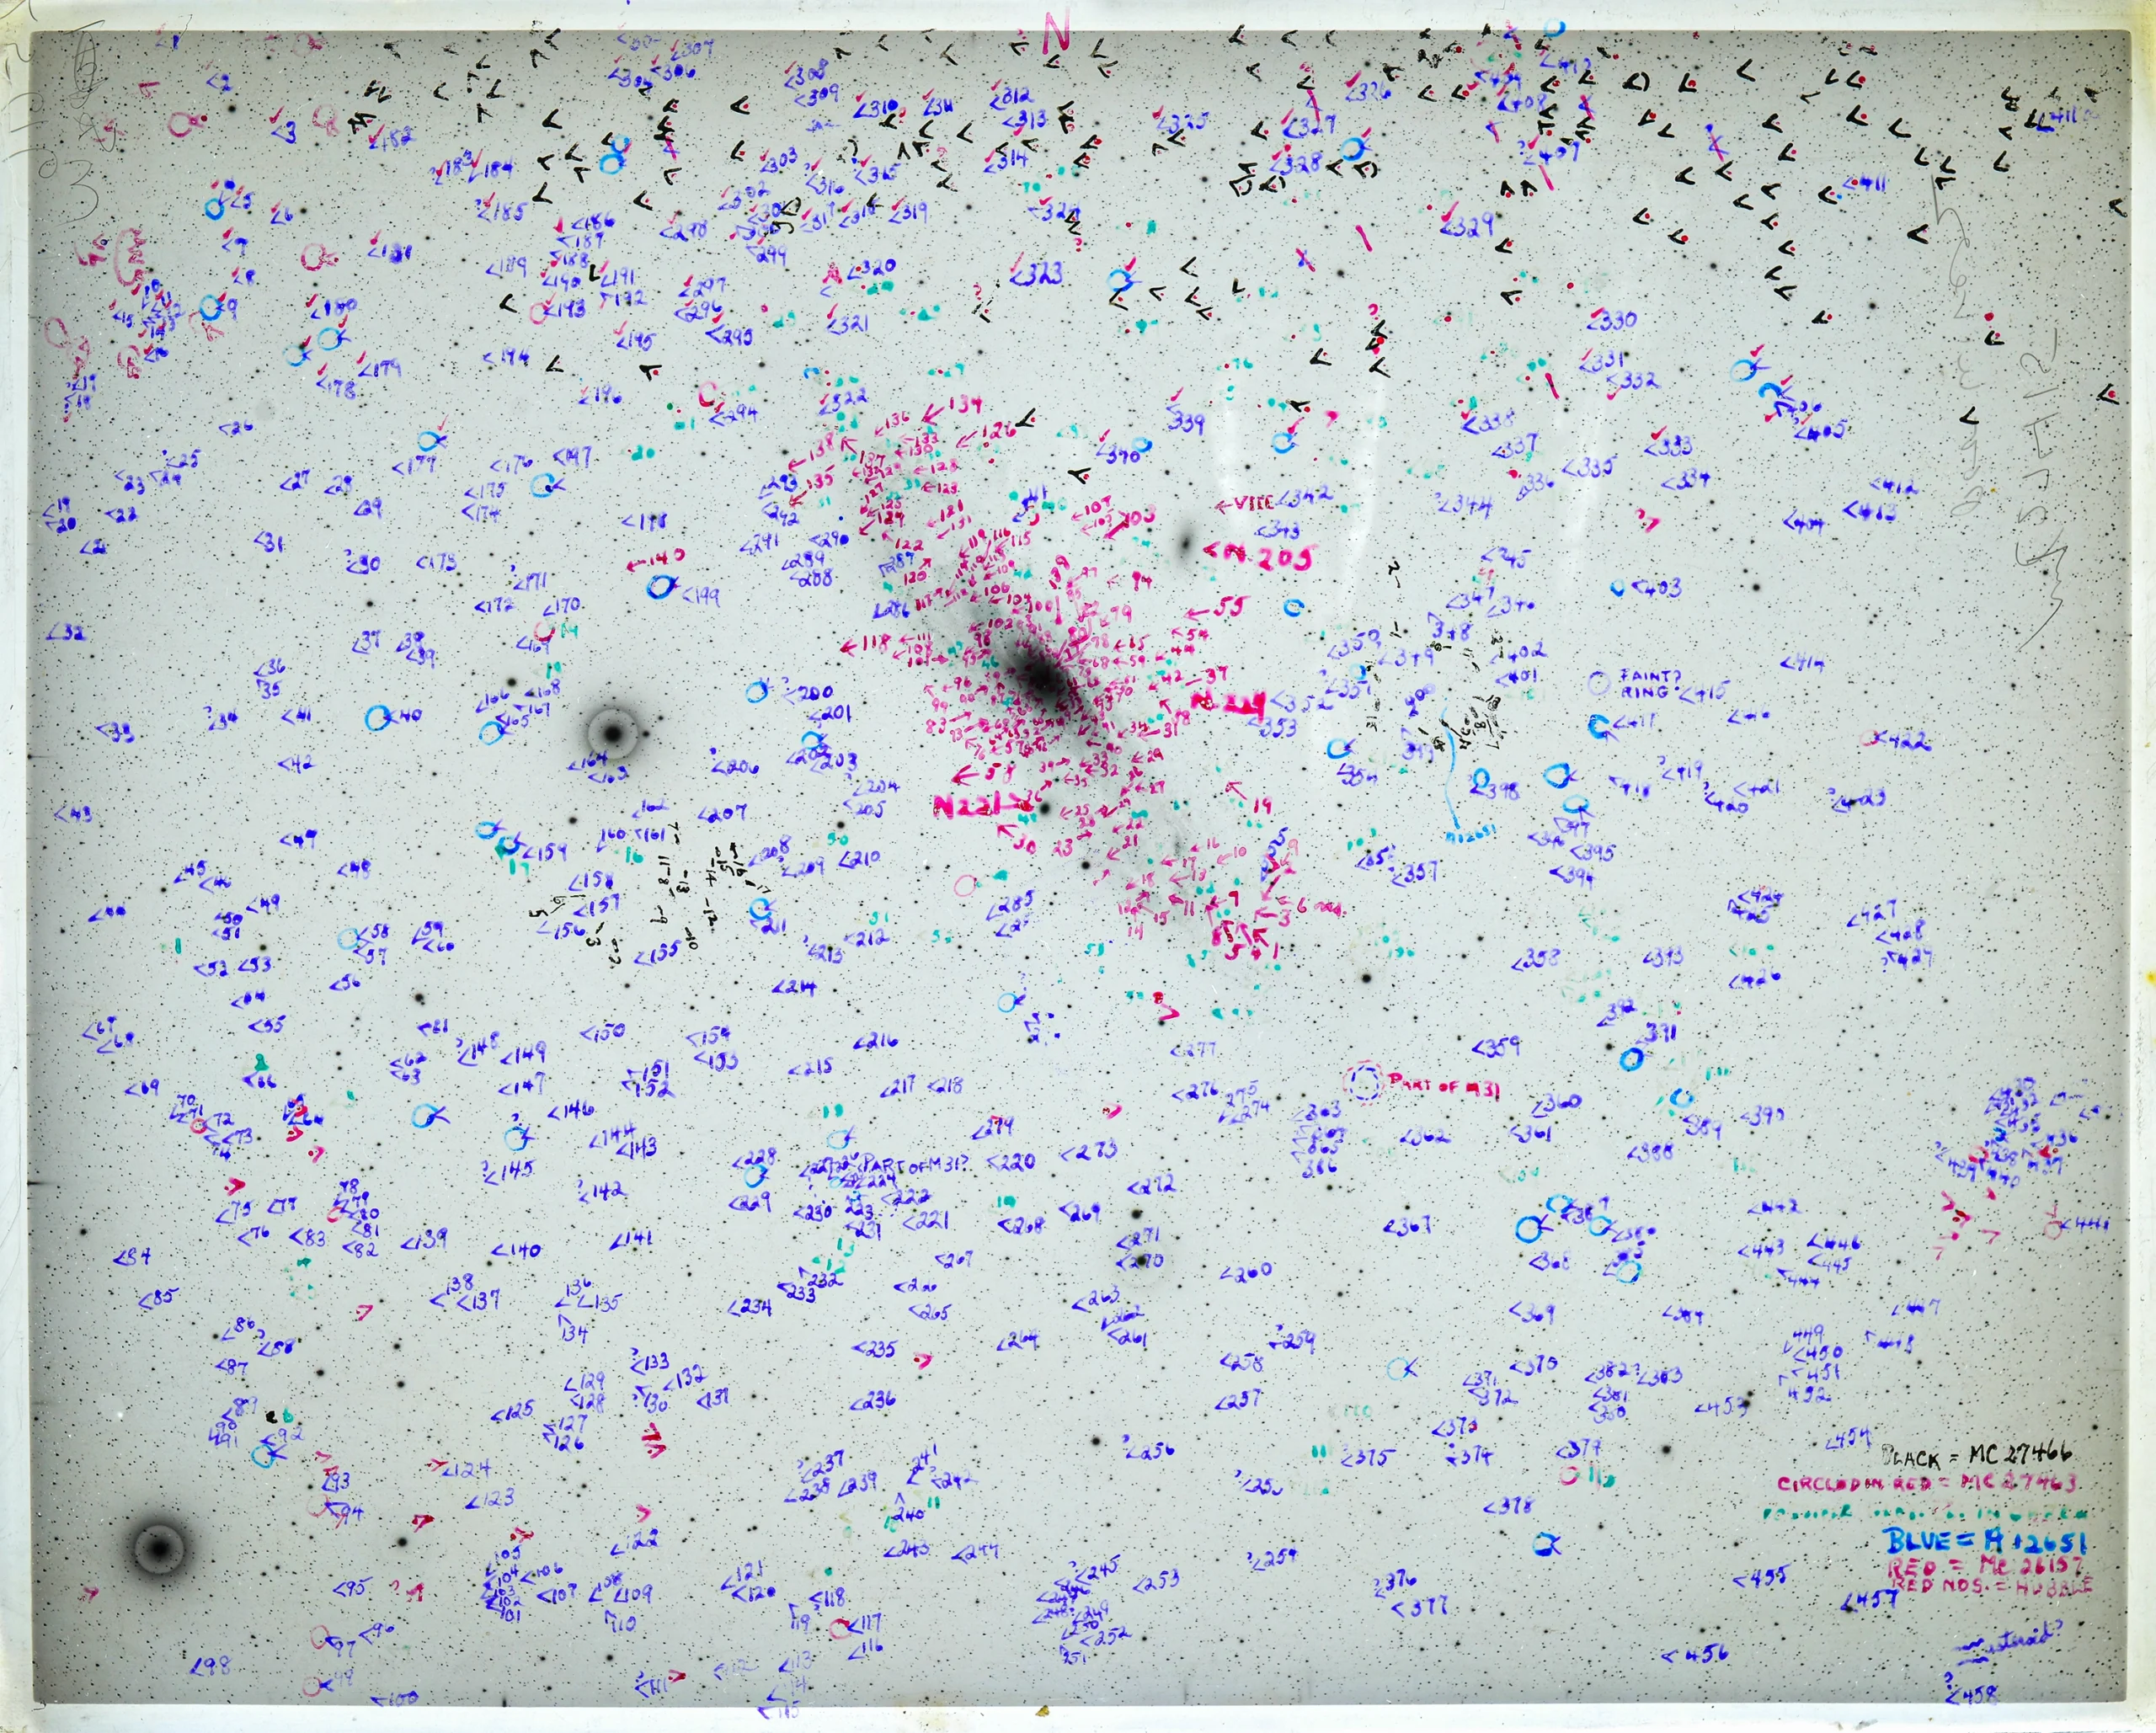
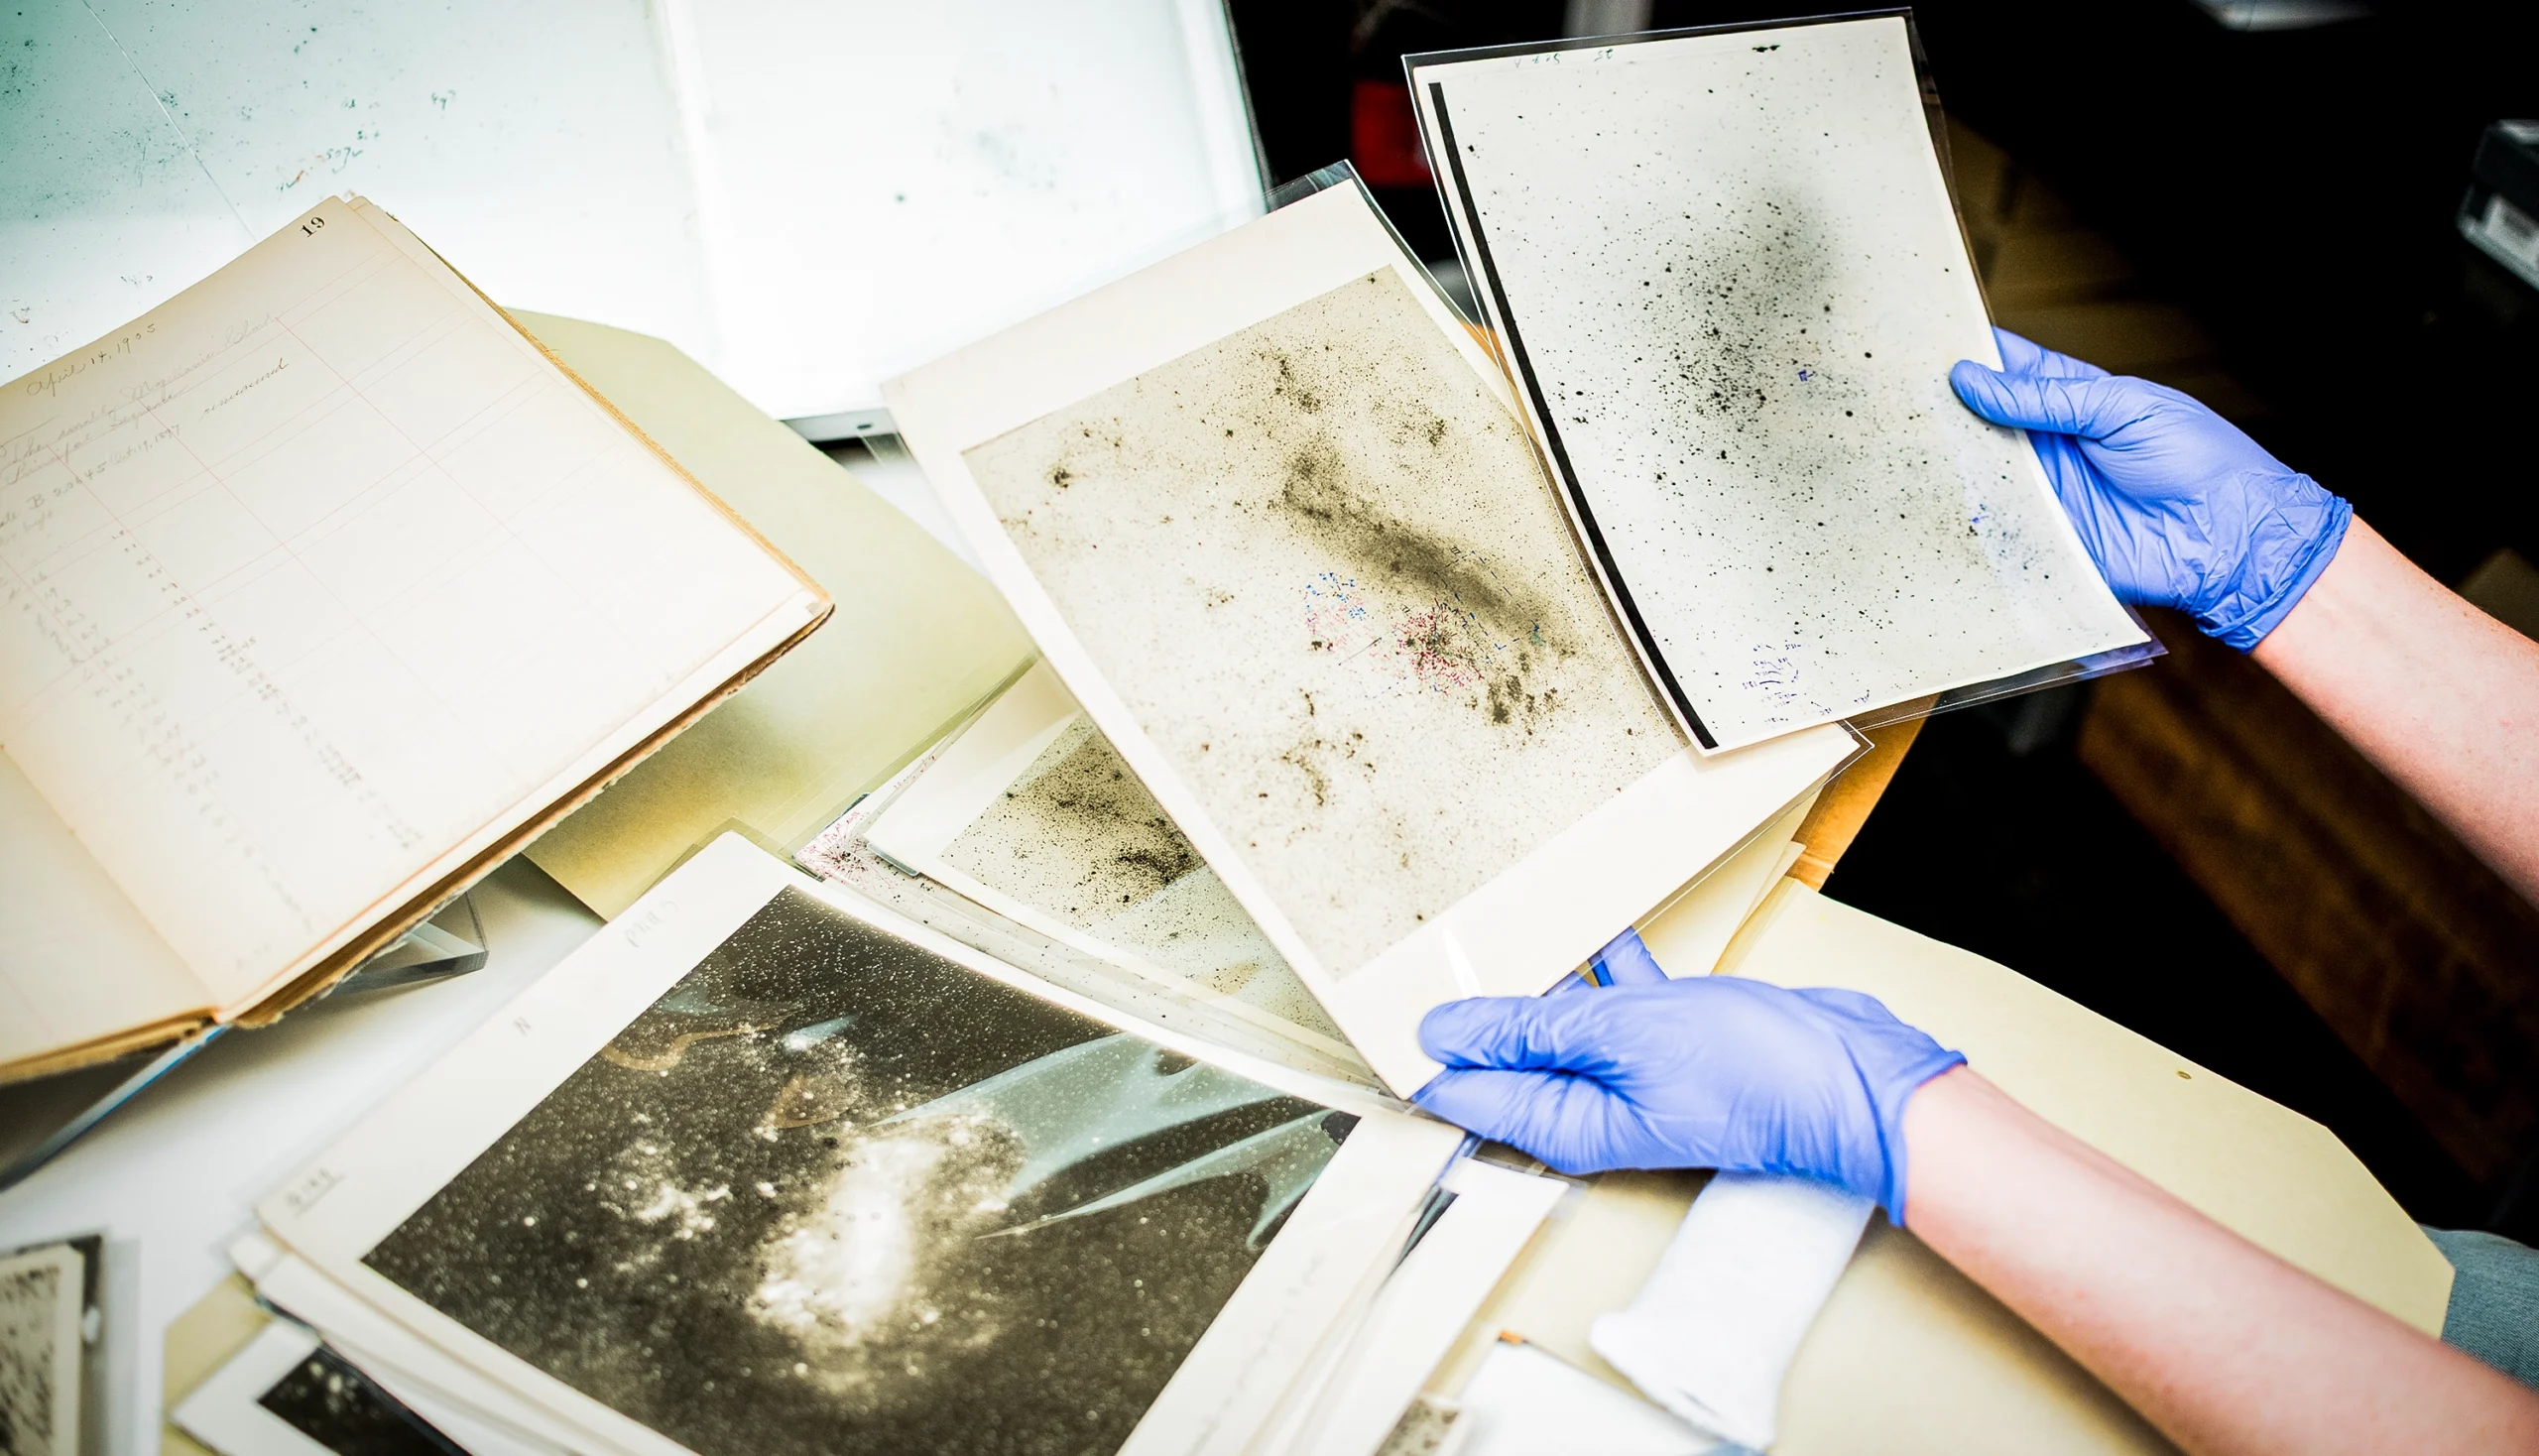
This 1934 plate of Andromeda, captured at the Oak Ridge Observatory at Harvard, was so heavily marked up because it was used to count galaxies.
Plate MC27415. September 11, 1934. Harvard Plate Stacks. Center for Astrophysics | Harvard & Smithsonian, Cambridge, Mass.
Hudec, the Czech astrophysicist, who has visited more than 70 plate collections across the world, estimates that there could be 10 million plates still in existence. If all those plates were carefully digitized, they would amount to thousands of terabytes of data. They hold more than a century of astronomical observations. And though they are scattered around the world and unwieldy to work with, they’ve provided today’s researchers with more than 100 modern discoveries.
The collection at the Harvard-Smithsonian Center for Astrophysics is the largest and best-studied astronomical plate archive in the world, with some 550,000. The collection covers both the northern and southern skies, with observations from 1849 through 1992. And some 430,000 of these are now in digital and searchable form thanks to a 20-year digitization project led by Jonathan Grindlay, an astrophysicist at Harvard University. “It seemed like a very obvious thing to do,” he said.
The Digital Access to a Sky Century at Harvard, or DASCH, has been cited in close to 100 scientific papers and talks, for discoveries covering all areas of time-domain astronomy. And that was the point, Grindlay said: “to be able to do time-domain astrophysics in a way that’s never been done before.”
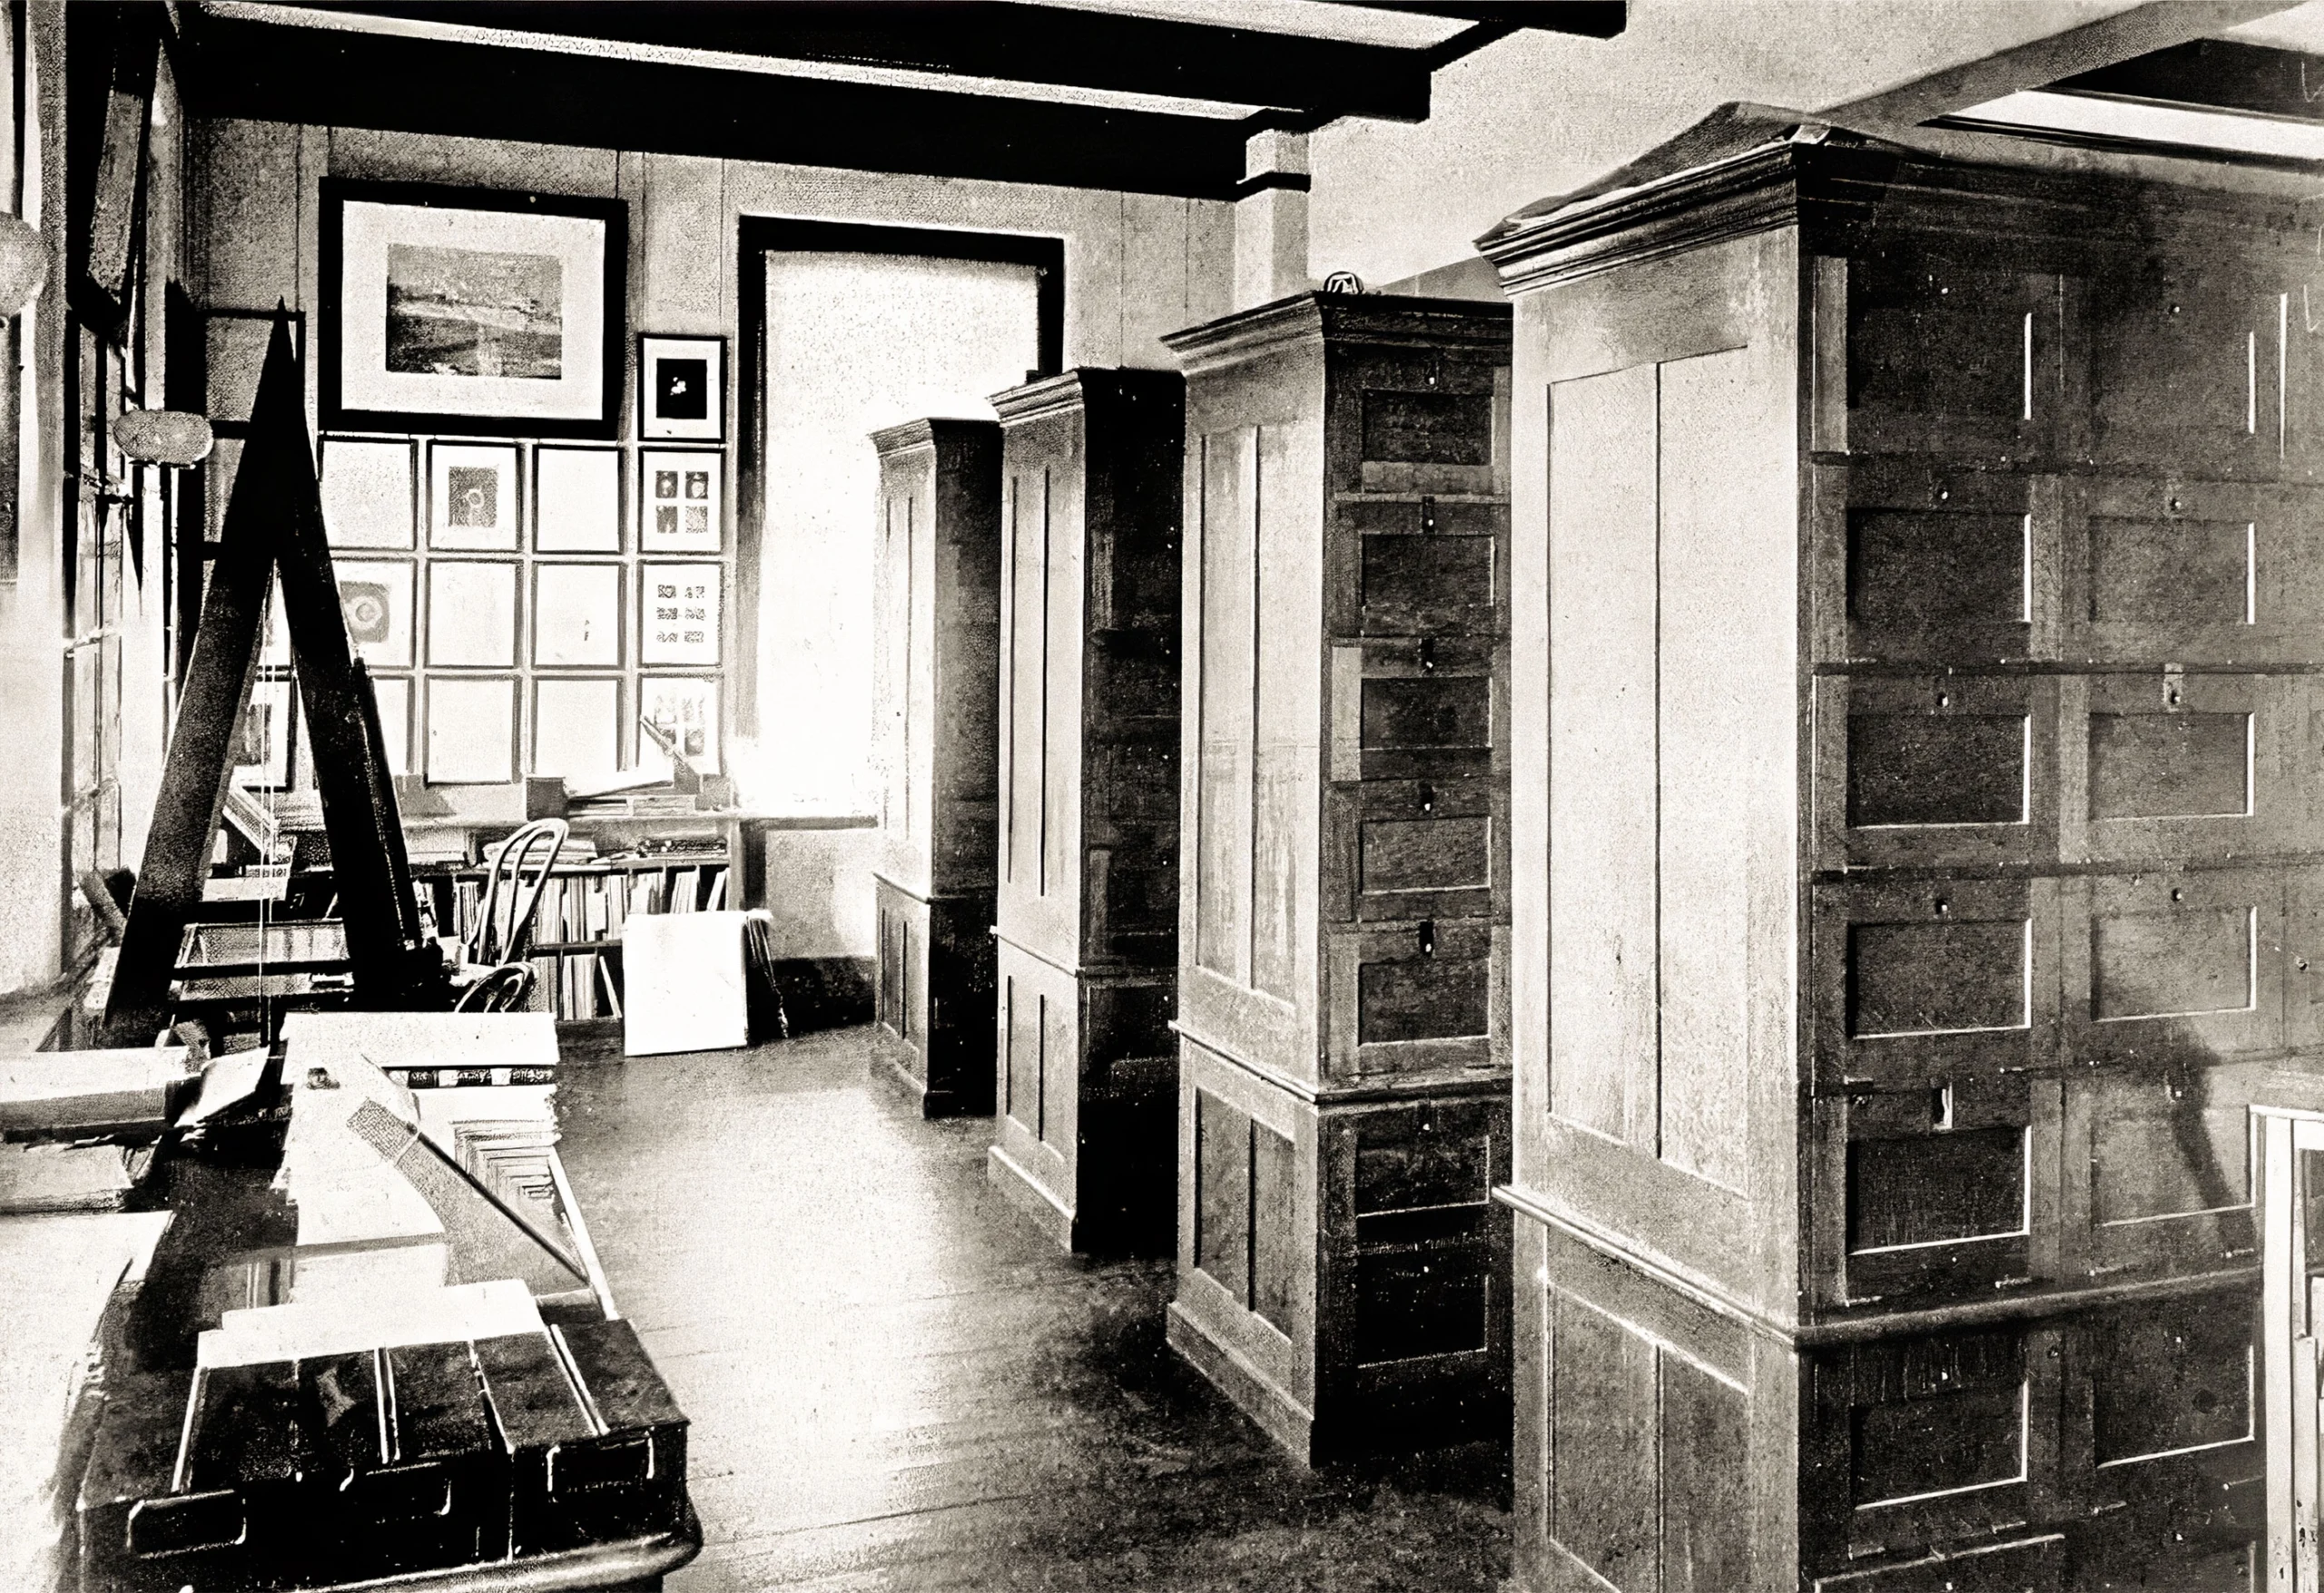
The Photographic Plate Archive at Harvard College Observatory in the 1890s. It would grow for another century.
Science History Images/Alamy
While most of Harvard’s plates are digitized, most plates in other archives are not. In addition, some astronomers who study those plates prefer to use the physical, tangible objects, so they can be sure that there are no artifacts from the scanning process. Time-domain differences can be subtle.
Rajka Jurdana-Šepić, an astrophysicist at the University of Rijeka in Croatia, always begins her plate searches with a set of 10 or more “wish-list” objects. While some astronomers, such as Hudec and Graham, might be looking for a few specific, active, variable supermassive black holes, others such as Jurdana-Šepić study bursting stars. The goal is to better understand the physical processes and mechanisms that cause brightness to change.
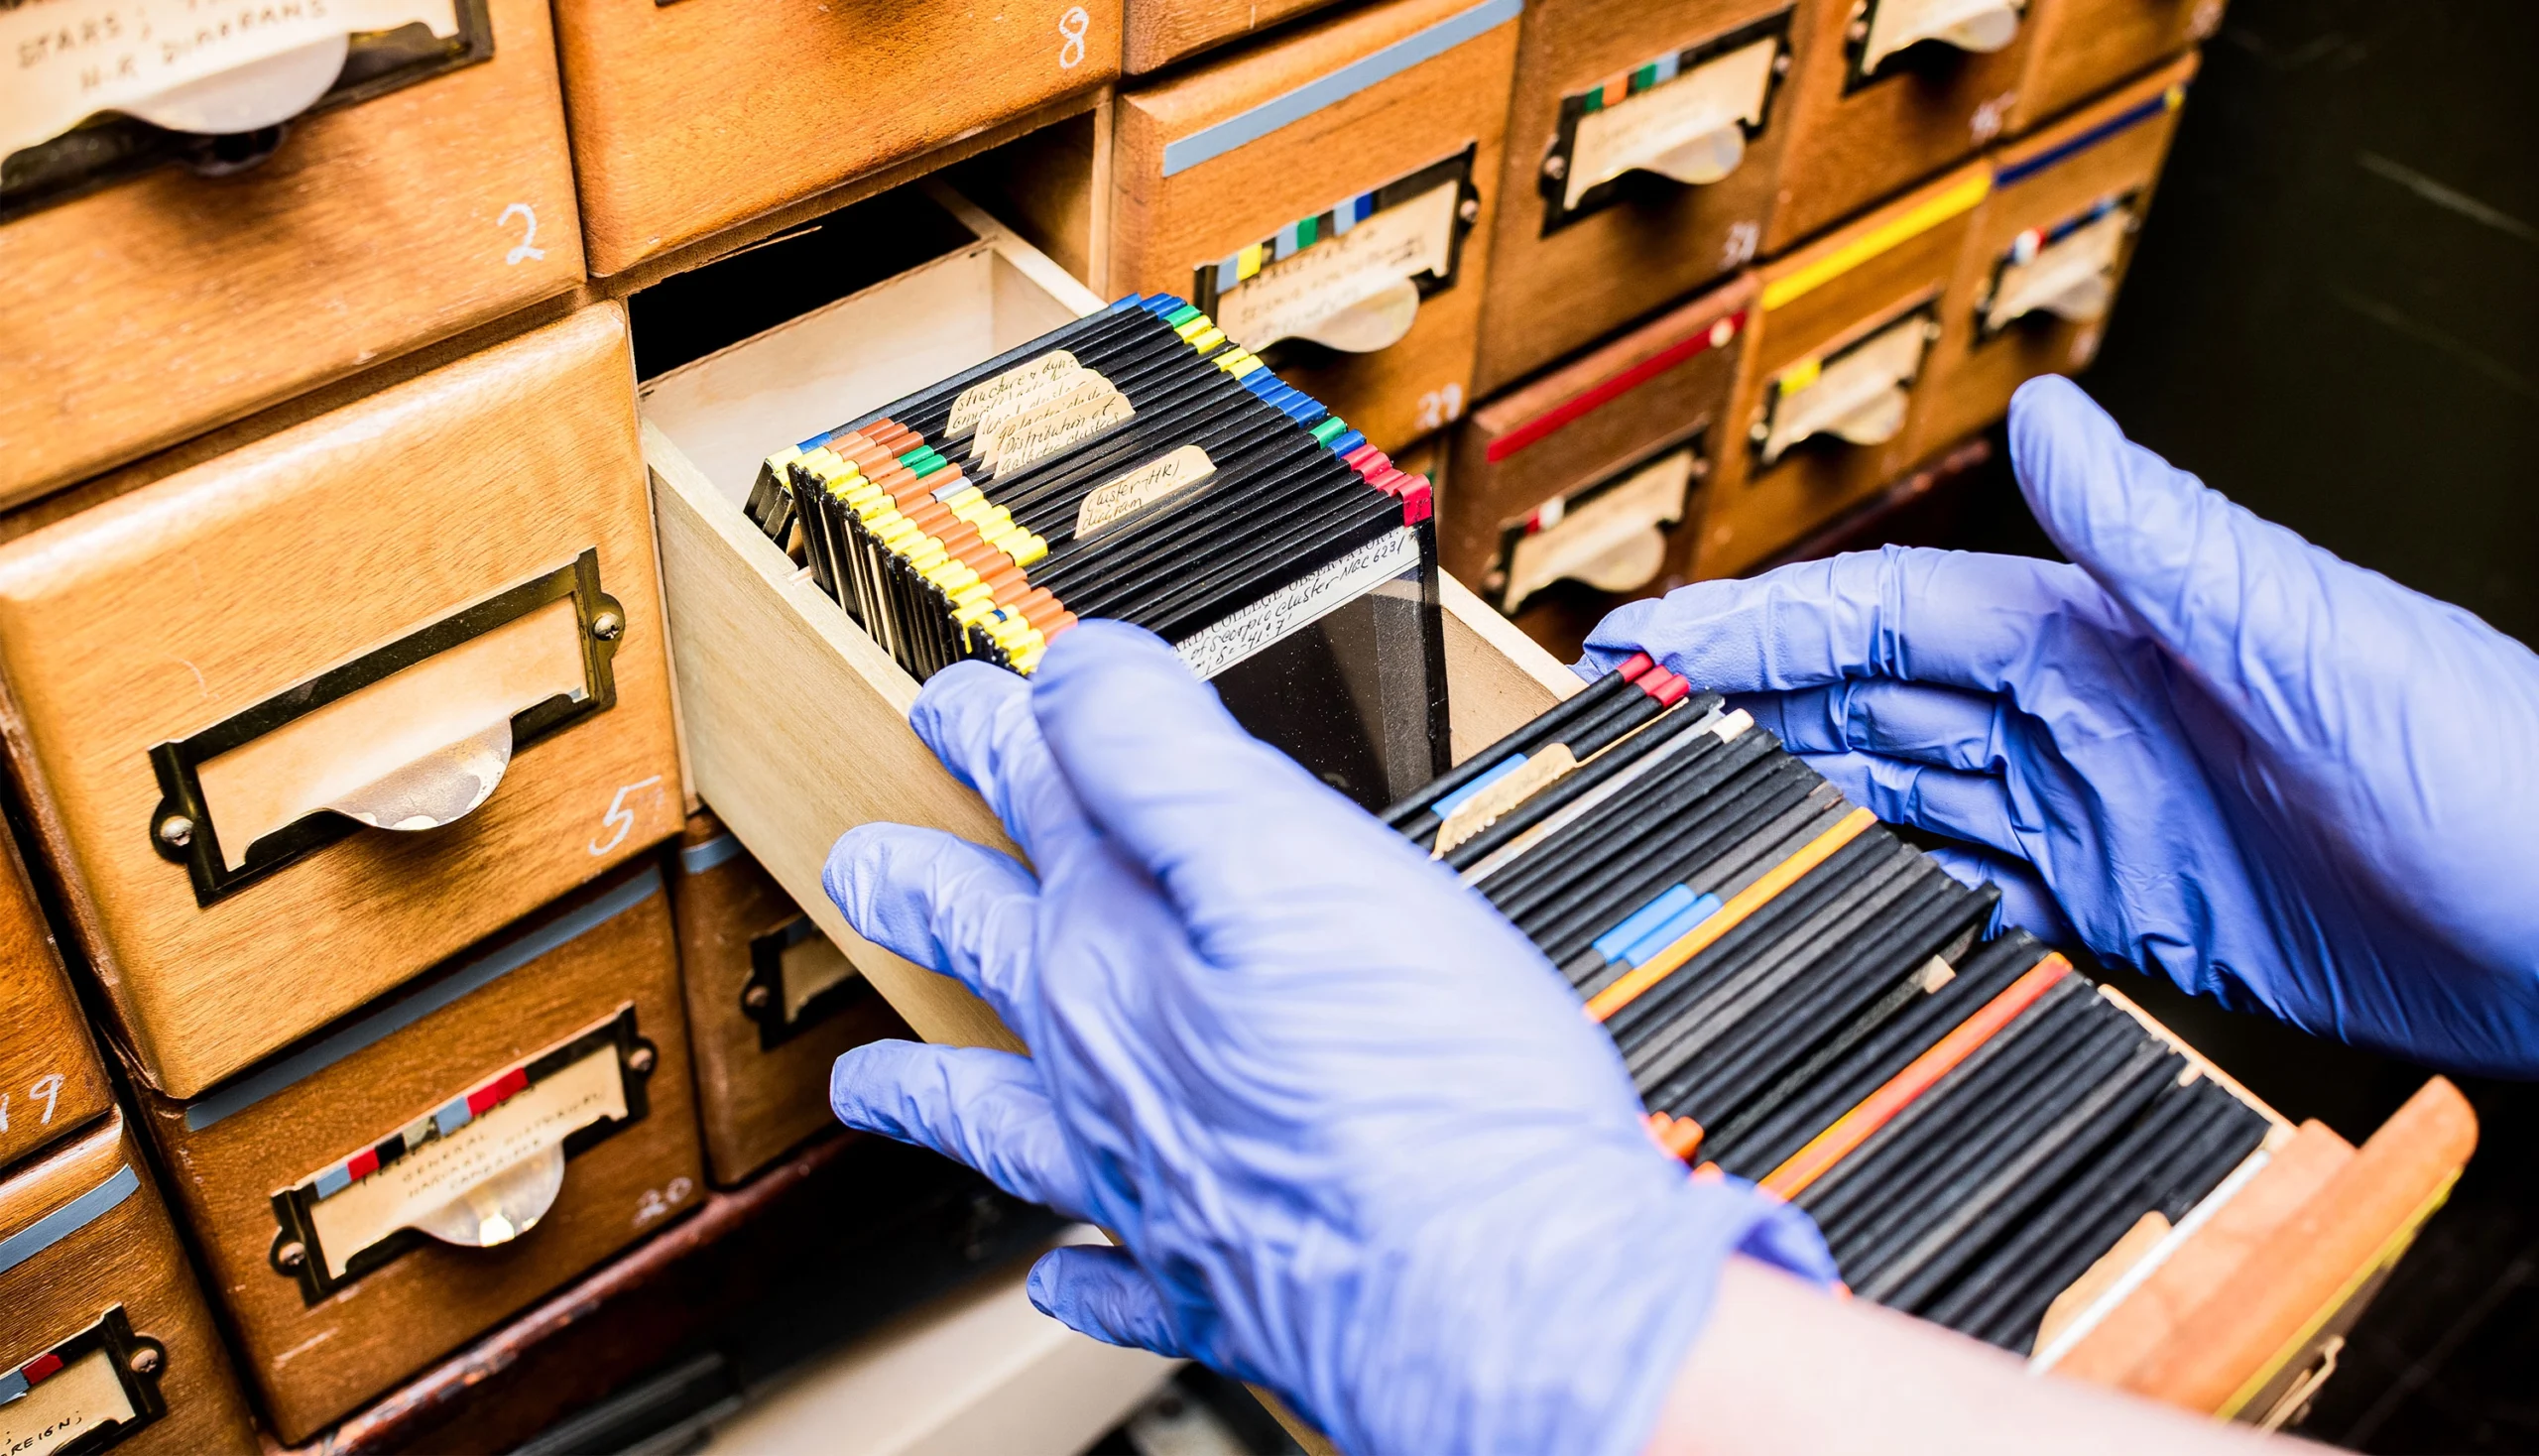
At plate stacks, such as the collection at the Asiago Astrophysical Observatory in Italy and the one at Harvard, Jurdana-Šepić pulls the plates she has targeted off the shelf. She carefully removes them from their paper jackets and places one plate at a time on a light table. Then comes the hard part: peering through a microscope to find her half-inch-wide field among thousands of black dots. Usually she can find the area within 20 minutes. Then she begins measuring. She prefers opera for this part: “Puccini, Verdi, or something in my ears, and thousands of plates on the table,” she said.
Her measurements involve comparing, by eye, her stellar target and bright stars of known magnitude in that same tiny field. “For example, seven grades from A, three grades from B,” she said. At the end of several weeks, she’ll have recorded a few hundred magnitude measurements across hundreds or even thousands of plates to build up a light curve for the object that spans decades.
René Hudec has visited more than 70 plate collections around the world, and estimates there could be 10 million surviving glass plates.
Courtesy of Rene Hudec
Bradley Schaefer, an astronomer at Louisiana State University, focuses on cataclysmic variable stars, objects that vary in brightness over time due to some type of major turmoil. His favorites are recurrent novas — binary systems in which a massive white dwarf siphons so much material from its partner that its surface becomes dense enough and hot enough to undergo nuclear fusion, resulting in a dramatic increase in brightness at least twice per century. More common novas work in a similar way, but their white dwarfs are smaller, meaning their bursts are much less frequent.
Scientists think there could be a connection between recurrent novas and Type Ia supernovas. These supernovas are critically important for measuring the expansion rate of the universe. Schaefer is testing the theory that recurrent novas could evolve into Type Ia supernovas.
By measuring their brightness over years, potentially over multiple fusion bursts, Schaefer could observe patterns and changes in these orbital systems. He’s been able to track the orbital periods of more than a dozen systems, and he has ruled out a few of them as potential precursors to a special type of supernova explosion.
For this work, “you need many decades’ worth of data,” Schaefer said. “Archival data [is] the only game in town.”
Historical Outbursts
If and when something in the cosmos goes bang, astronomers want to know its history. Older data lets them observe earlier blips, flares, or other activity, and “that then helps the interpretation, and maybe suggests a different model,” Graham said.
The AGNs that Graham studies are active supermassive black holes and their surrounding accretion disks. These vary randomly, so describing their brightness changes is complex. While scientists have 60 years of targeted data and 5 million time series images of AGNs, he said, “we still really don’t understand the mechanisms by which they are variable.”
Graham is co-leader and project scientist at the Zwicky Transient Facility (ZTF), another sky survey looking for changing cosmic objects. ZTF uses the 48-inch Oschin Schmidt telescope at Mount Palomar in California. The telescope bridges the eras of observational astronomy. Today it boasts sophisticated digital detectors, but it was also used for foundational surveys in the days of glass photographic plates. Graham recently acquired 20 terabytes of historical data: the digitized versions of the plates captured during the Palomar Observatory Sky Survey (POSS), first conducted in the 1940s and 1950s, and its successor POSS-II, which spanned the 1980s and 1990s.
This won’t be the first time he has combined data from multiple surveys, although in the past he’s focused on putting together digital surveys only. Combining datasets from multiple telescopes and observations requires calibration to account for different optics, filters, and detectors.
A physical plate, or a scanned image of one, adds further complications, Griffin said. The photographic emulsion’s density — those dark marks — relates in a very specific way to the incoming starlight’s intensity.
But the astronomers who know how to read the plates can combine their measurements with ones from more recent surveys for a longer-term view. Schaefer uses data from multiple space telescopes, but they’re not suited to his purpose unless paired with ground-based datasets and the more historical forms of observation. “It’s just one point,” he said of the space telescope images, “where the story is told over the century.”
Race Against Time
Every telescope that astronomers used to document the sky during the century before 1980 used glass plate photography. The plates, if stored in stable conditions and not piled up with weight on top of them, can endure for centuries.
Unfortunately, some collections were misplaced when university departments switched buildings. Others have even been thrown into the garbage. Of the many that have survived, their condition can be a concern; some glass plates are cracked or little more than shards. In other cases, the emulsion is peeling due to humidity swings or growing mold from water exposure.
Both Hudec and Griffin are strong proponents of the value in these historical artifacts. Both have also seen collections destroyed and data saved.
Griffin spoke of an experience at a collection overseas. She reached into a box filled with plate envelopes to pull out a plate with the spectrum of the bright star Arcturus. “The emulsion fell off,” she said. “Only the glass came up.” All the plates in the box were the same. They had apparently been moved too quickly from high humidity to low humidity.
Surviving plate collections can be a constant source of discovery. And with careful scanning, the data they hold can be invaluable, full of hidden surprises from a century of astronomical flares, bursts, and more. The Rubin Observatory will lead to many incredible discoveries; its early images already have. But the lifetimes of cosmic objects are long, and understanding today’s data relies on yesterday’s, in the form of stacks and stacks of glorious glass. That’s why, Griffin said, “it’s so desperately important to keep them.”